Do KL’s pricier areas complain more about food prices? No. I had AI read 22,093 Google reviews of places to eat for what they say about price, and counted 557,001 Google “price per person” answers. A Mont Kiara meal costs more than twice a Kajang one, but both fault the price about as often.
What I found.
The charts are free to use with a link to this page.
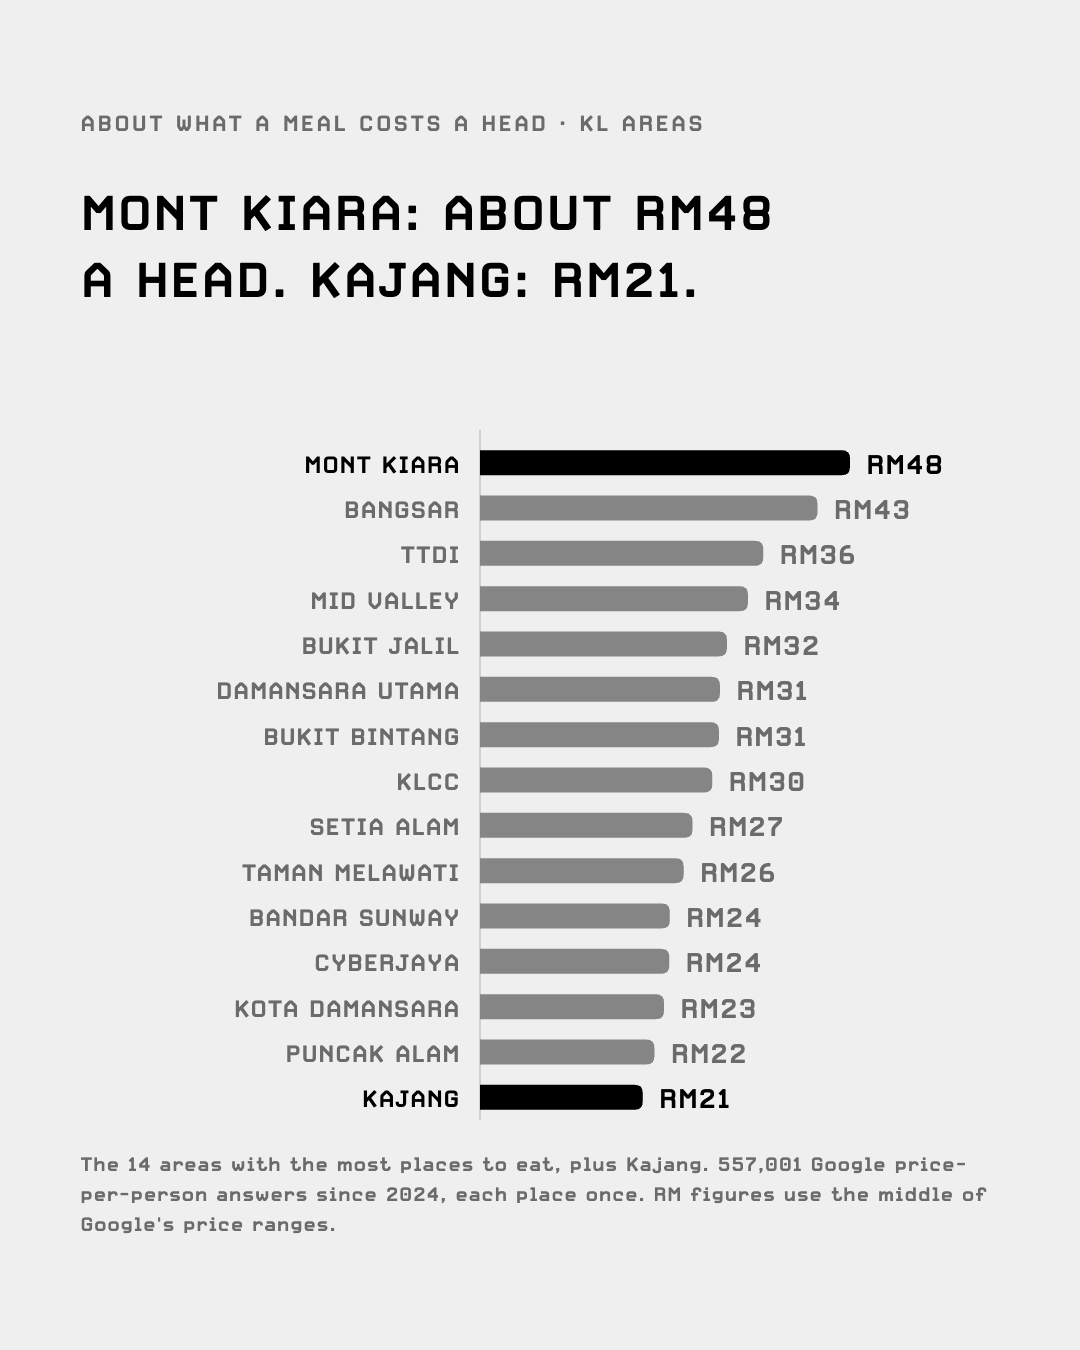
1. A Mont Kiara meal costs more than twice a Kajang one.
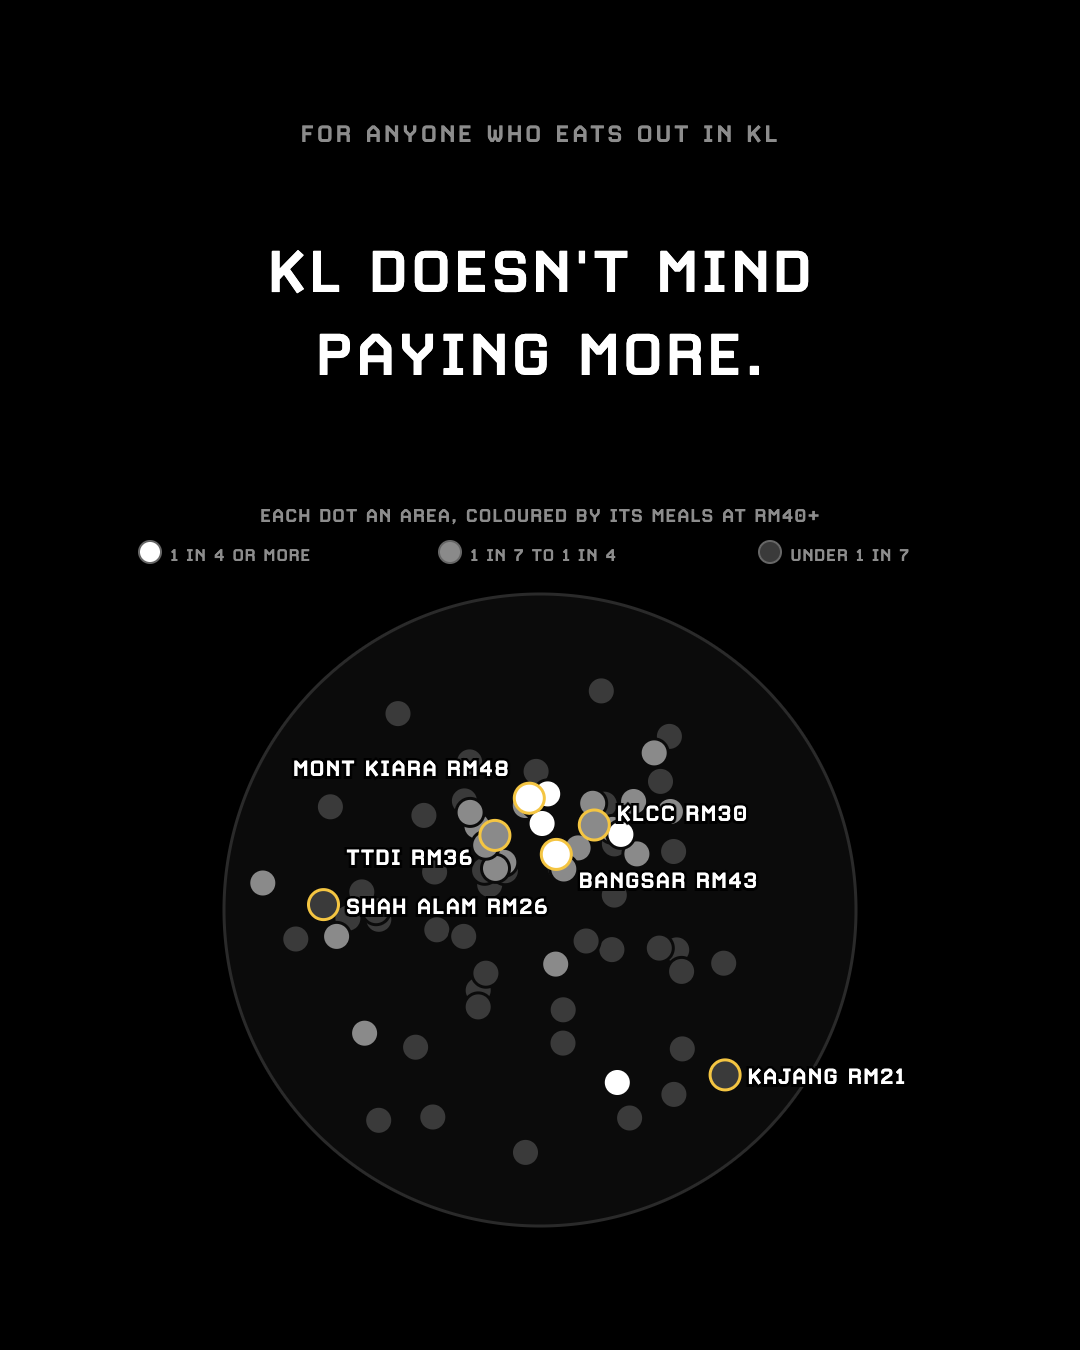
What a meal costs: Mont Kiara tops 88 Klang Valley areas, with 37% of meals at RM40 or more (about RM48 a head). Kajang: 7% (about RM21). KLCC is only 18th, below TTDI (8th), and that holds for restaurants alone.
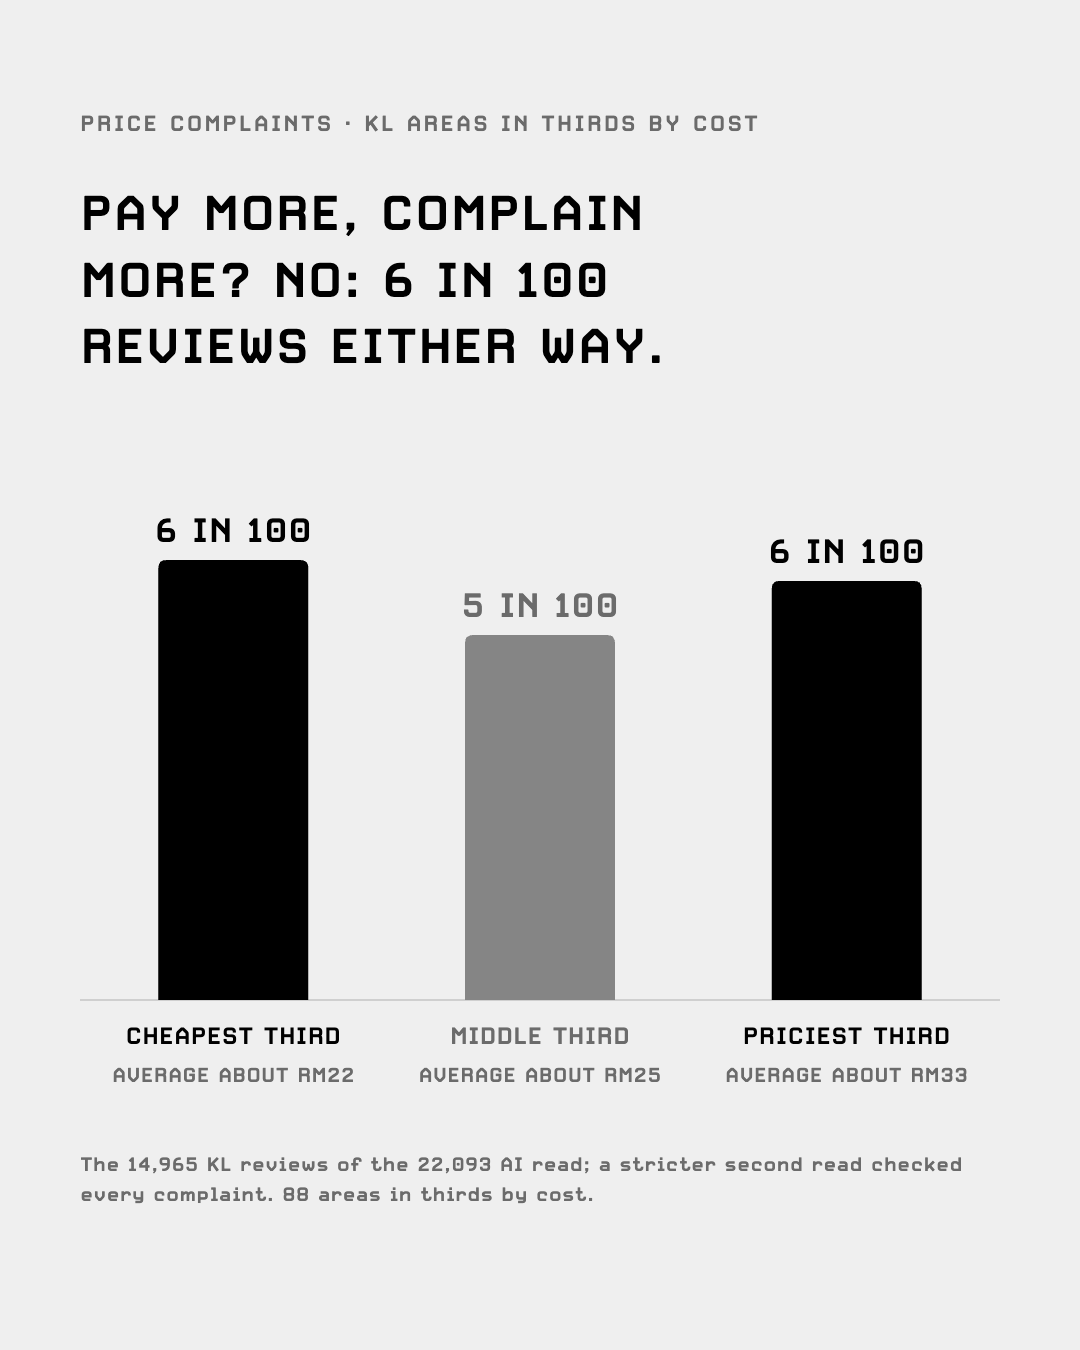
2. KL’s priciest areas don’t complain more.
Price complaints don’t climb with price: KL areas in thirds by cost (about RM22, RM25, RM33 a head) fault the price in 6, 5, 6 of every 100 reviews. Ranking single areas by complaints was noise: split each area’s places in two and the rankings didn’t agree.
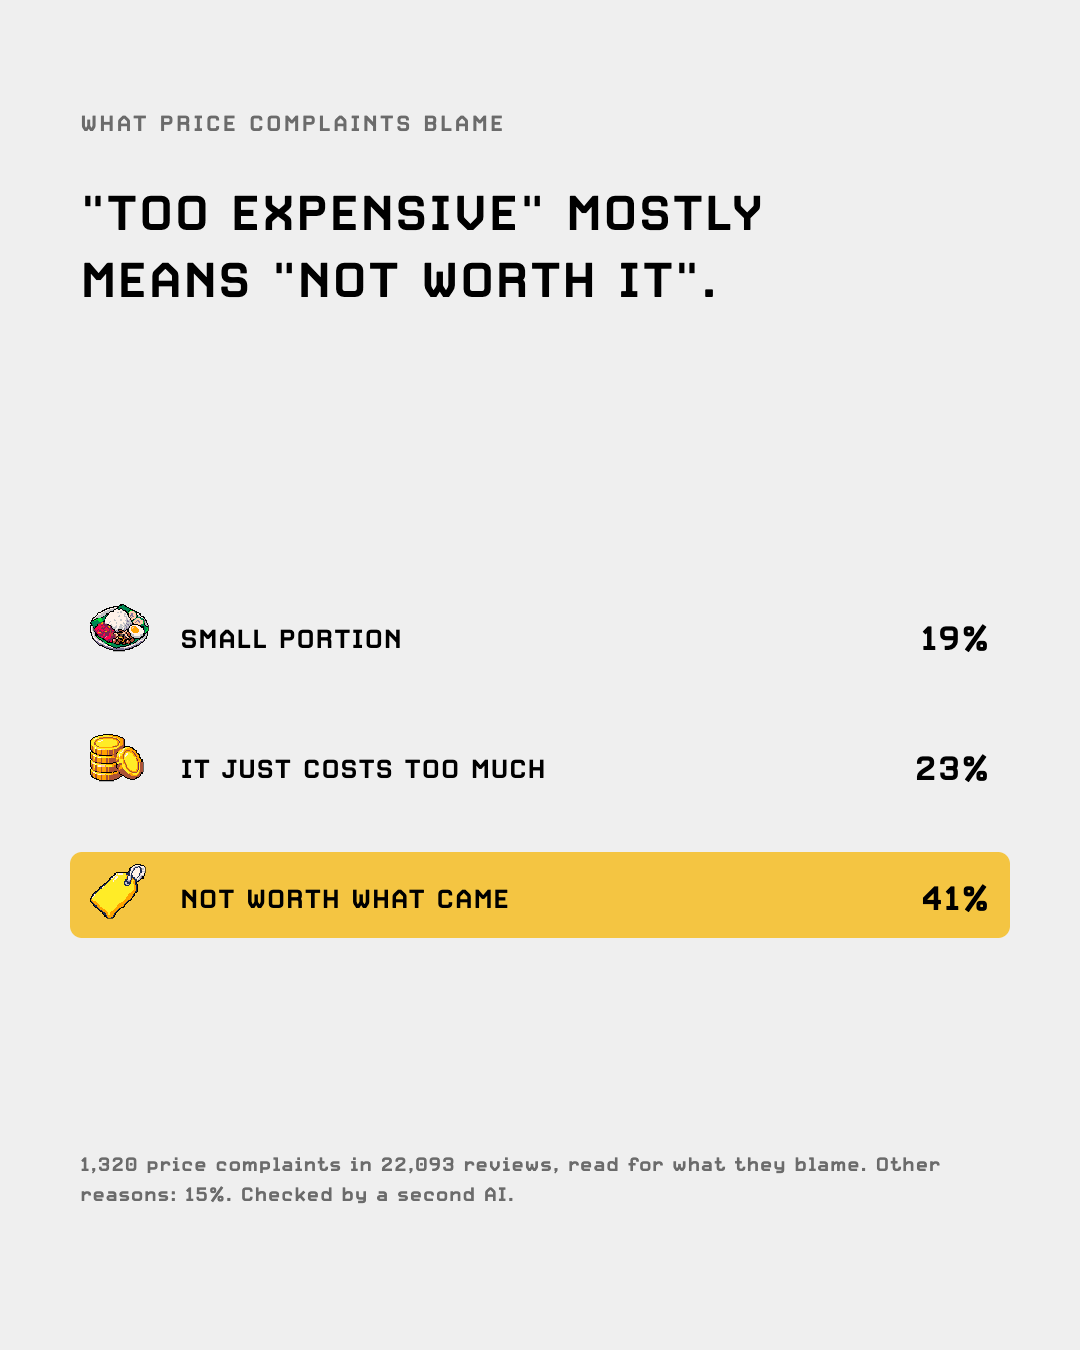
3. “Too expensive” mostly means “not worth it”.
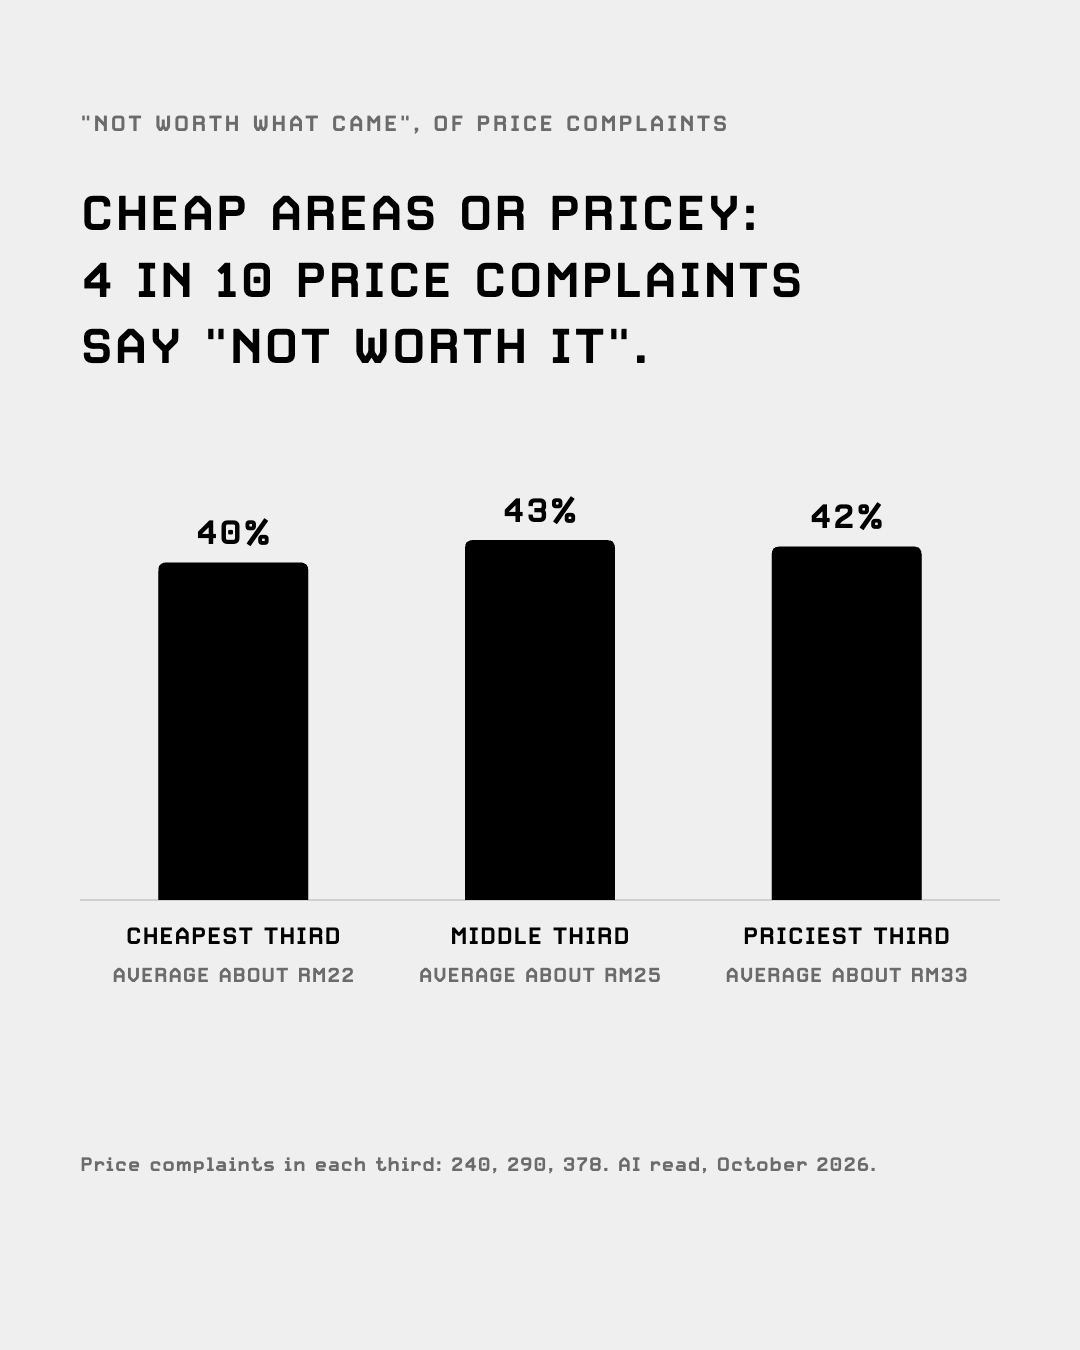
What “too expensive” means: of 1,320 price complaints, 41% say it wasn’t worth what came, 23% just say it costs too much, 19% name a small portion. “Not worth it” is about 4 in 10 in every price third.
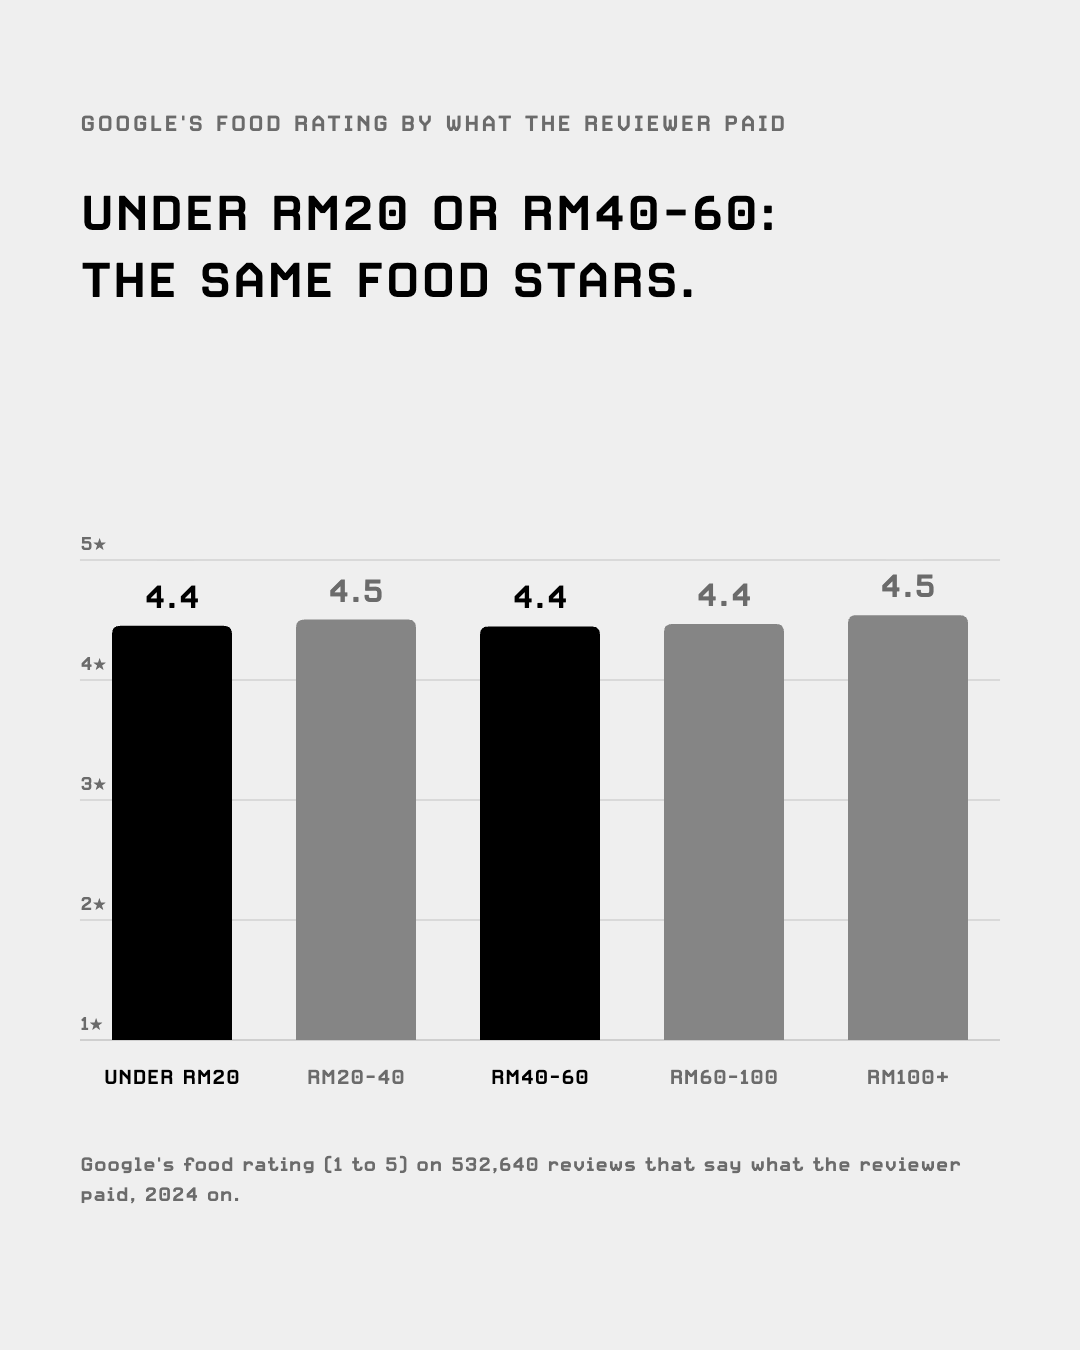
4. A RM10 meal and a RM50 meal get the same stars.
Food ratings barely move with what people paid: Google’s food rating is 4.4 (Under RM20), 4.5 (RM20–40), 4.4 (RM40–60), 4.4 (RM60–100), 4.5 (RM100+), from 532,640 reviews. Only RM100+ gets a few more five-star ratings (75% against 68% under RM20).
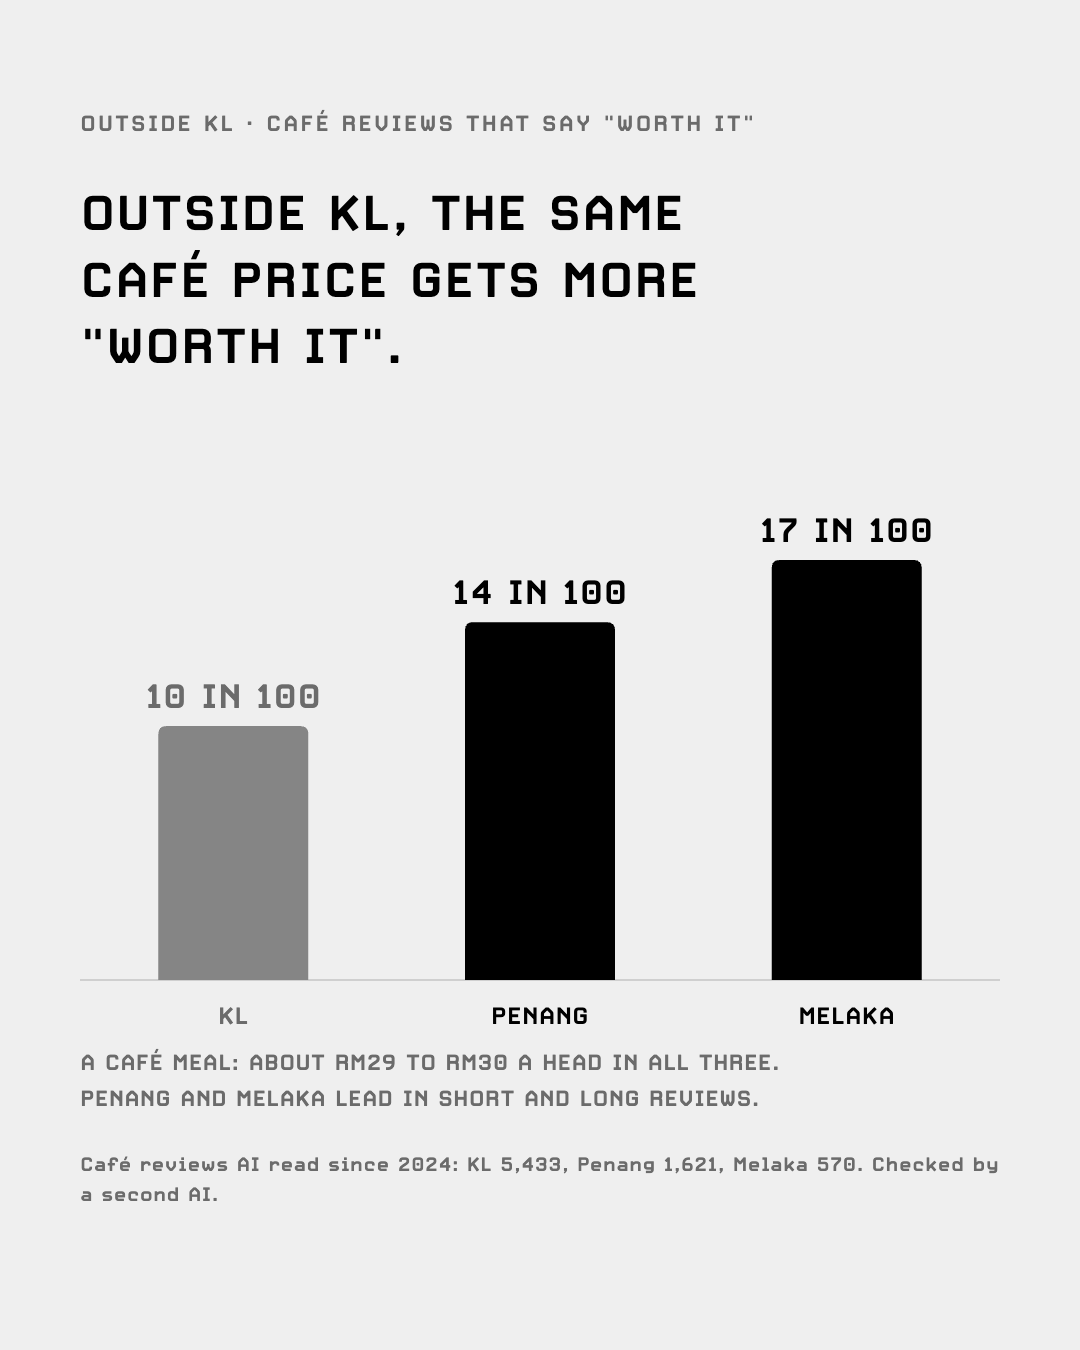
5. Penang and Melaka cafés get more “worth it”.
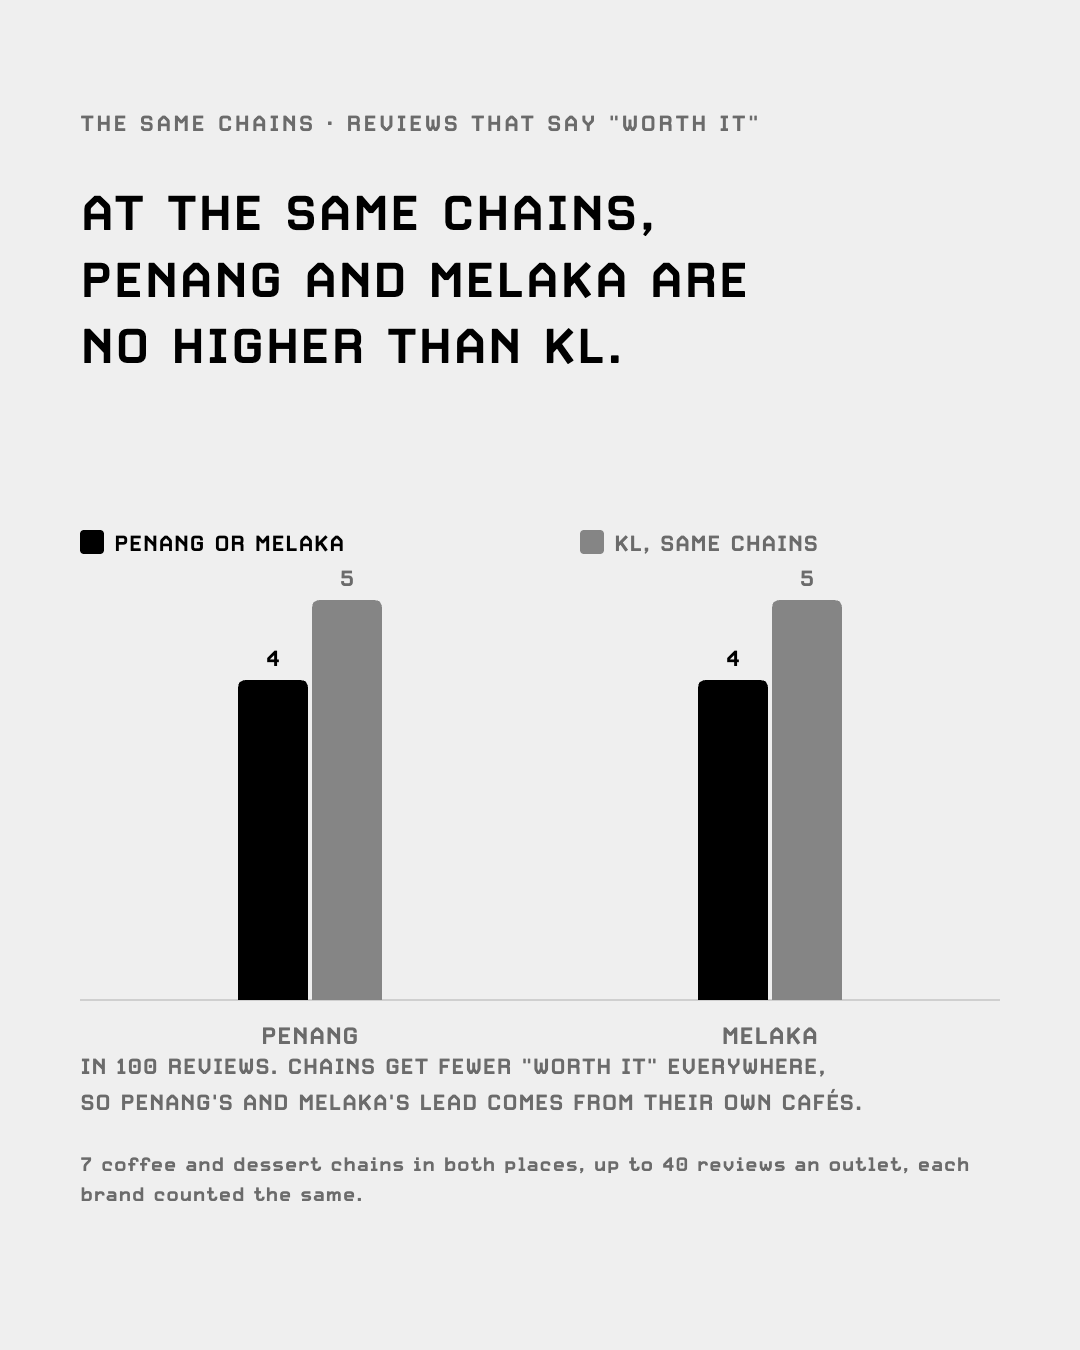
Penang and Melaka cafés get called “worth it” more: 14 and 17 in 100 reviews against 10 in KL, at about the same price a head, and in short and long reviews alike. At the same 7 chains there’s no gap (Penang 4, KL 5), so it’s their own cafés, not the people.
What a meal costs in every area.
88 Klang Valley areas with 15 or more places to eat, ranked by the share of meals at RM40 or more. Google’s “price per person” answers since January 2024, each place counted once.
| Rank | Area | Meals RM40+ | Meals under RM20 | A head | Places |
|---|---|---|---|---|---|
| 1 | Mont Kiara | 37% | 23% | about RM48 | 115 |
| 2 | Bangsar | 33% | 33% | about RM43 | 162 |
| 3 | Solaris Dutamas · Publika | 29% | 34% | about RM39 | 32 |
| 4 | Bukit Damansara | 27% | 37% | about RM36 | 30 |
| 5 | IOI Resort City | 26% | 34% | about RM36 | 36 |
| 6 | Imbi | 25% | 36% | about RM34 | 31 |
| 7 | Sri Hartamas | 24% | 35% | about RM38 | 22 |
| 8 | TTDI | 24% | 41% | about RM36 | 145 |
| 9 | Desa Sri Hartamas | 24% | 32% | about RM36 | 17 |
| 10 | Mid Valley | 24% | 39% | about RM34 | 59 |
| 11 | Chow Kit | 21% | 48% | about RM31 | 45 |
| 12 | Bukit Bintang | 21% | 42% | about RM31 | 81 |
| 13 | Bukit Jalil | 21% | 37% | about RM32 | 61 |
| 14 | KL Sentral | 19% | 45% | about RM35 | 21 |
| 15 | Kota Kemuning | 19% | 43% | about RM29 | 22 |
| 16 | Damansara Utama | 19% | 42% | about RM31 | 118 |
| 17 | Shah Alam Seksyen 14 | 18% | 37% | about RM34 | 18 |
| 18 | KLCC | 18% | 43% | about RM30 | 117 |
| 19 | Semenyih | 18% | 50% | about RM31 | 27 |
| 20 | Kampung Datuk Keramat | 18% | 44% | about RM29 | 26 |
| 21 | Mutiara Damansara | 17% | 46% | about RM29 | 43 |
| 22 | Brickfields | 17% | 59% | about RM28 | 24 |
| 23 | Maluri | 16% | 48% | about RM28 | 27 |
| 24 | Taman Dato Ahmad Razali | 16% | 43% | about RM28 | 20 |
| 25 | Petaling Jaya Seksyen 19 | 16% | 39% | about RM28 | 15 |
| 26 | Bandar Utama | 15% | 44% | about RM28 | 28 |
| 27 | Bandar Botanik | 15% | 33% | about RM30 | 43 |
| 28 | Bandar Seri Putra | 15% | 58% | about RM27 | 22 |
| 29 | Wangsa Maju | 15% | 47% | about RM27 | 34 |
| 30 | Petaling Jaya Seksyen 17 | 15% | 37% | about RM27 | 17 |
| 31 | Setia Alam | 15% | 45% | about RM27 | 58 |
| 32 | SS 2 | 14% | 40% | about RM27 | 25 |
| 33 | Shah Alam Seksyen 9 | 14% | 48% | about RM27 | 24 |
| 34 | Sepang | 14% | 56% | about RM26 | 15 |
| 35 | Kampung Baru | 14% | 55% | about RM25 | 34 |
| 36 | Bandar Bukit Raja | 14% | 49% | about RM29 | 28 |
| 37 | Putrajaya Presint 15 | 13% | 53% | about RM25 | 17 |
| 38 | Taman Melawati | 13% | 47% | about RM26 | 65 |
| 39 | Jade Hills | 13% | 42% | about RM25 | 15 |
| 40 | Pudu | 13% | 54% | about RM25 | 22 |
| 41 | Bandar Sri Damansara | 13% | 45% | about RM26 | 26 |
| 42 | Bandar Rimbayu | 13% | 52% | about RM25 | 23 |
| 43 | Bandar Sunway | 12% | 56% | about RM24 | 67 |
| 44 | Shah Alam | 12% | 53% | about RM26 | 28 |
| 45 | Damansara Perdana | 12% | 53% | about RM25 | 29 |
| 46 | Alam Damai | 12% | 50% | about RM25 | 18 |
| 47 | Bandar Puteri Puchong | 12% | 47% | about RM25 | 44 |
| 48 | Bandar Tasik Puteri | 12% | 62% | about RM24 | 18 |
| 49 | Putra Heights | 12% | 58% | about RM23 | 16 |
| 50 | Cyberjaya | 12% | 57% | about RM24 | 65 |
| 51 | Sijangkang | 11% | 65% | about RM22 | 24 |
| 52 | Bandar Sri Permaisuri | 11% | 58% | about RM24 | 21 |
| 53 | Shah Alam Seksyen 7 | 11% | 57% | about RM24 | 48 |
| 54 | Denai Alam | 11% | 57% | about RM24 | 15 |
| 55 | Tadisma Business Park | 11% | 65% | about RM22 | 15 |
| 56 | Bukit Jelutong | 11% | 50% | about RM24 | 40 |
| 57 | Taman Equine | 11% | 48% | about RM26 | 19 |
| 58 | Kota Damansara | 11% | 55% | about RM23 | 64 |
| 59 | Petaling Jaya Seksyen 13 | 11% | 52% | about RM24 | 23 |
| 60 | Tun Hussein Onn | 11% | 55% | about RM24 | 15 |
| 61 | SS 15 | 11% | 54% | about RM25 | 33 |
| 62 | Bandar Baru Sri Petaling | 11% | 45% | about RM26 | 30 |
| 63 | Pandan Indah | 11% | 62% | about RM23 | 25 |
| 64 | Cheras | 11% | 52% | about RM24 | 18 |
| 65 | Kota Warisan | 11% | 57% | about RM23 | 30 |
| 66 | Puncak Alam | 11% | 65% | about RM22 | 49 |
| 67 | Bandar Saujana Utama | 11% | 67% | about RM25 | 17 |
| 68 | Bandar Bukit Mahkota | 10% | 50% | about RM25 | 22 |
| 69 | Bandar Baru Salak Tinggi | 10% | 68% | about RM20 | 25 |
| 70 | Shah Alam Seksyen 13 | 10% | 57% | about RM23 | 39 |
| 71 | Klang Kawasan 1 | 10% | 53% | about RM23 | 16 |
| 72 | Bandar Bukit Tinggi | 10% | 59% | about RM23 | 16 |
| 73 | Setiawangsa | 10% | 66% | about RM21 | 21 |
| 74 | Taman Paramount | 10% | 47% | about RM23 | 15 |
| 75 | Sungai Besi | 9% | 65% | about RM21 | 16 |
| 76 | Bukit Rahman Putra | 9% | 65% | about RM21 | 16 |
| 77 | Ara Damansara | 9% | 50% | about RM22 | 42 |
| 78 | Bandar Puchong Jaya | 9% | 53% | about RM23 | 26 |
| 79 | Bandar Mahkota Cheras | 9% | 48% | about RM24 | 22 |
| 80 | Bandar Saujana Putra | 8% | 72% | about RM18 | 17 |
| 81 | Meru | 8% | 66% | about RM20 | 28 |
| 82 | Bandar Baru Bangi Seksyen 9 | 8% | 63% | about RM21 | 24 |
| 83 | Pusat Bandar Puchong | 7% | 61% | about RM20 | 15 |
| 84 | Kajang | 7% | 59% | about RM21 | 47 |
| 85 | Segambut | 7% | 52% | about RM21 | 15 |
| 86 | Taman Sri Gombak | 6% | 62% | about RM21 | 18 |
| 87 | Puncak Jalil | 5% | 72% | about RM19 | 15 |
| 88 | KL Eco City | 4% | 69% | about RM17 | 18 |
If I ran a place to eat.
Before cutting prices, I’d check whether the plate matches the price: portions, and what comes with it. A test, not a promise: reviews show what goes together, not what causes it.
How I did it.
AI (Codex) read 22,093 Google reviews written since January 2024 of 6,612 places to eat (Google’s own restaurant, café and food categories; no bars) in the Klang Valley, Penang, Melaka and Johor Bahru, at most 6 a place and 300 an area, for what each says about price. A stricter second pass re-read every complaint, and another model (Claude) checked samples of each label: 25 to 29 of 30 agreed for the ones shown. Code counted Google’s “price per person” answer on 557,001 reviews, each place counted once (places with 5+ answers), and Google’s food rating on 532,640.
What it can’t tell you.
Google reviews aren’t everyone: people who mind prices may just not go, or not write. “About RM” uses the middle of each Google price band, so it’s an estimate; the shares of meals at RM40+ are exact. Areas are Google’s neighbourhood names. Everything here shows what goes together, not what causes what.
Say hello.
Writing about food prices, or want the numbers? Email me at [email protected].
Run a place to eat? Ask for a free check of your place.
What I do with it.
Reading what people already say is one way I find what to build.


