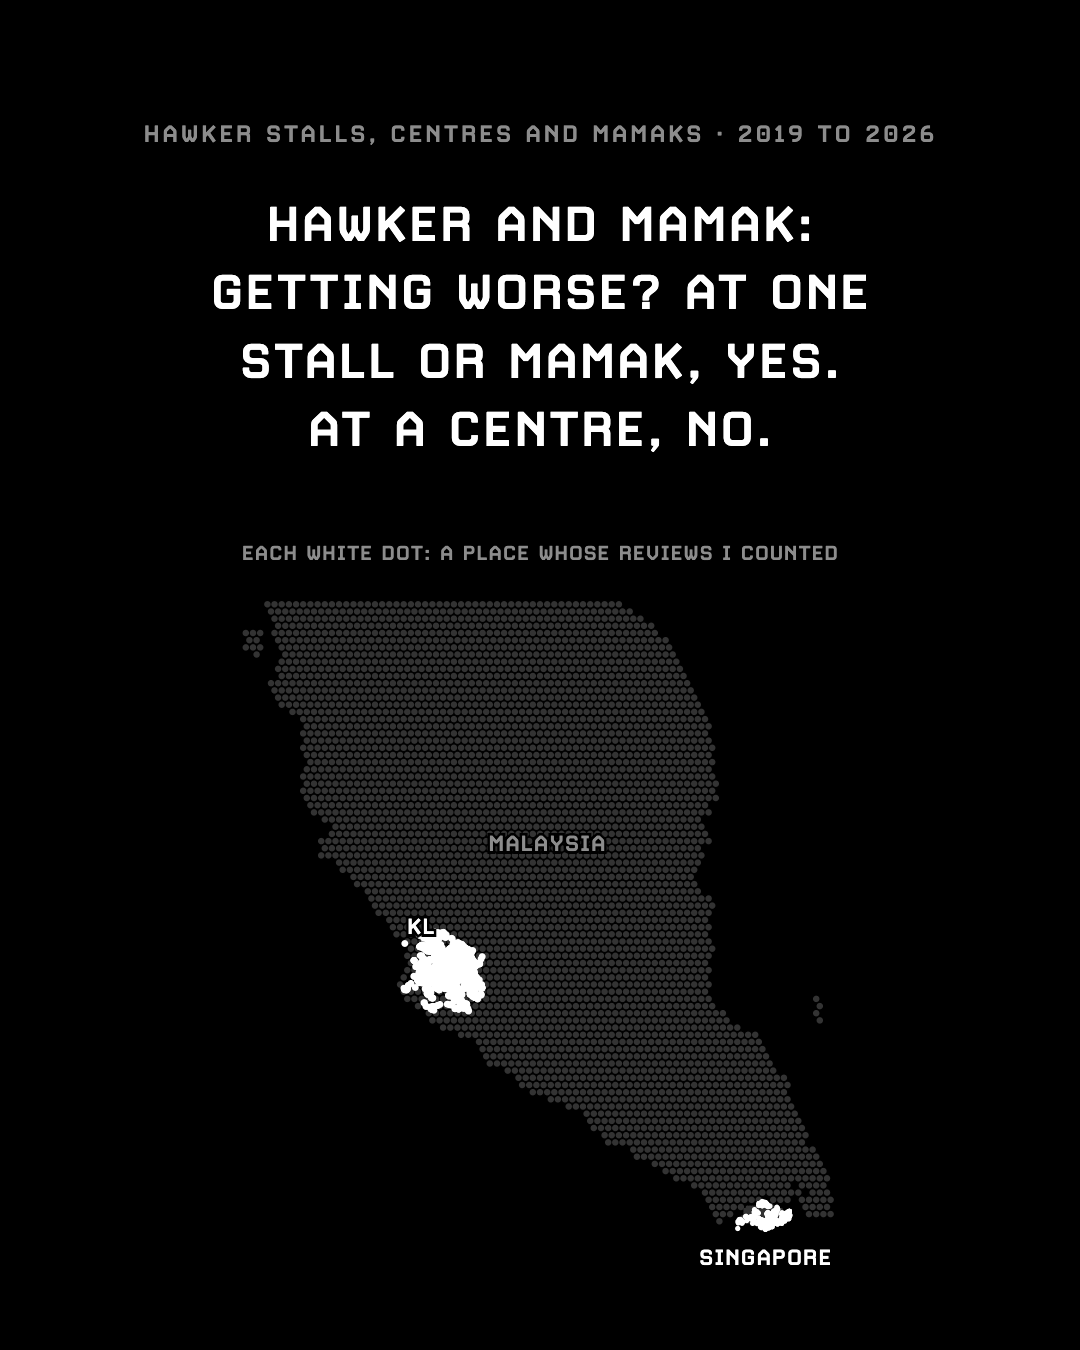
Is hawker and mamak food getting worse? People on both sides of the Causeway say so. I counted every Google star at the same places since 2019: 96 Singapore hawker stalls, 114 hawker centres and 1,080 KL mamaks, with KL cafés as a check. Then AI read 3,247 of the reviews to see what people blame and praise.
What I found.
The charts are free to use with a link to this page.
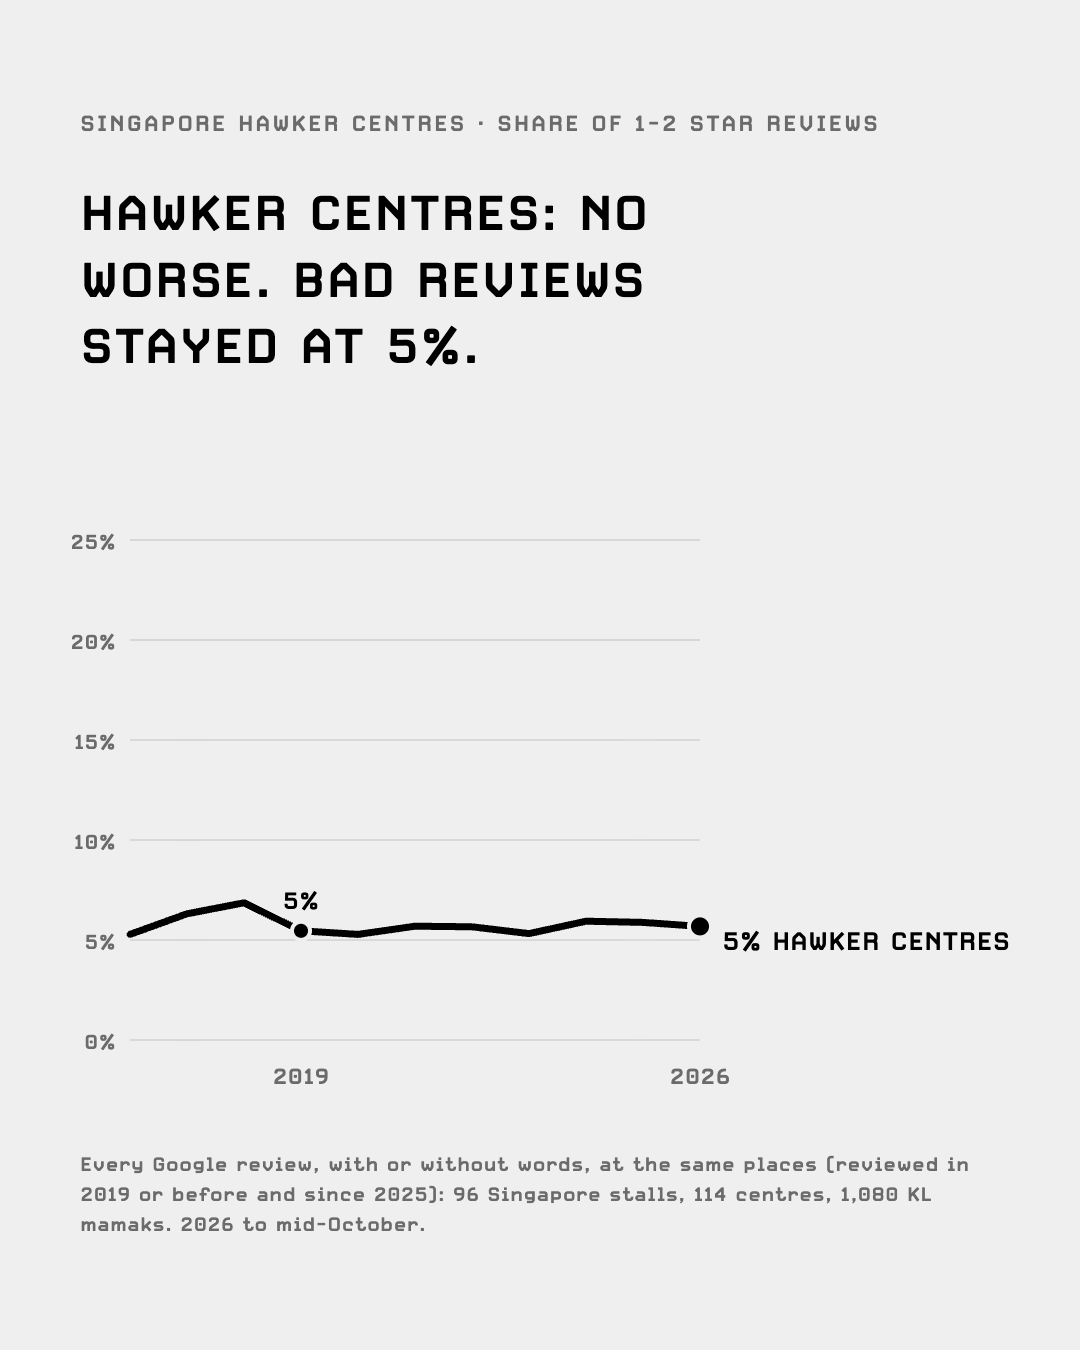
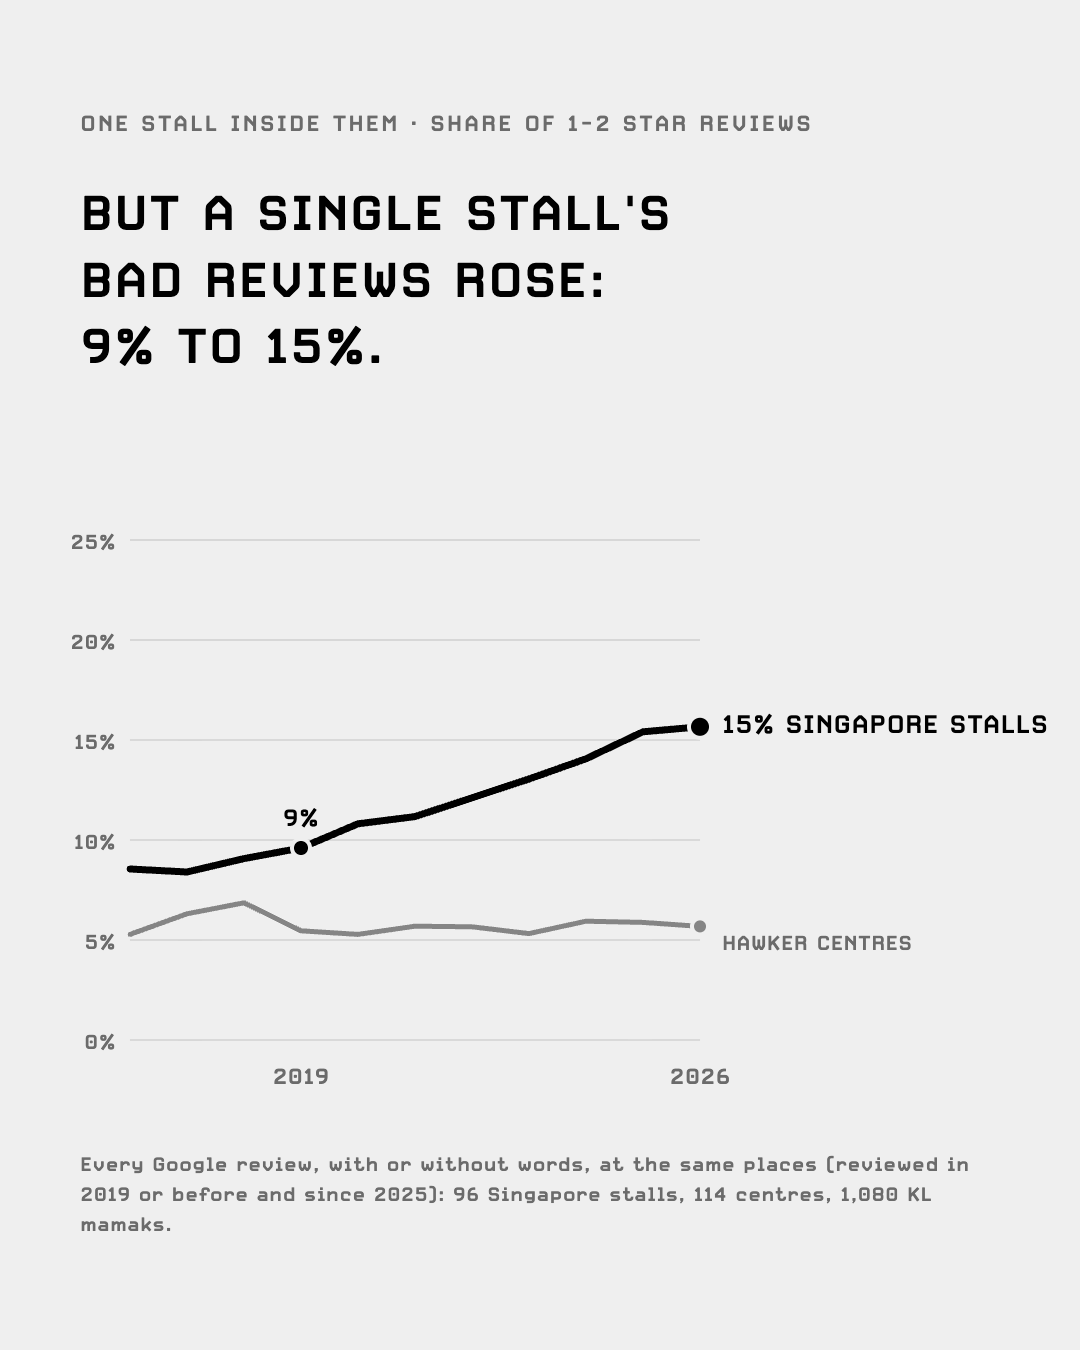
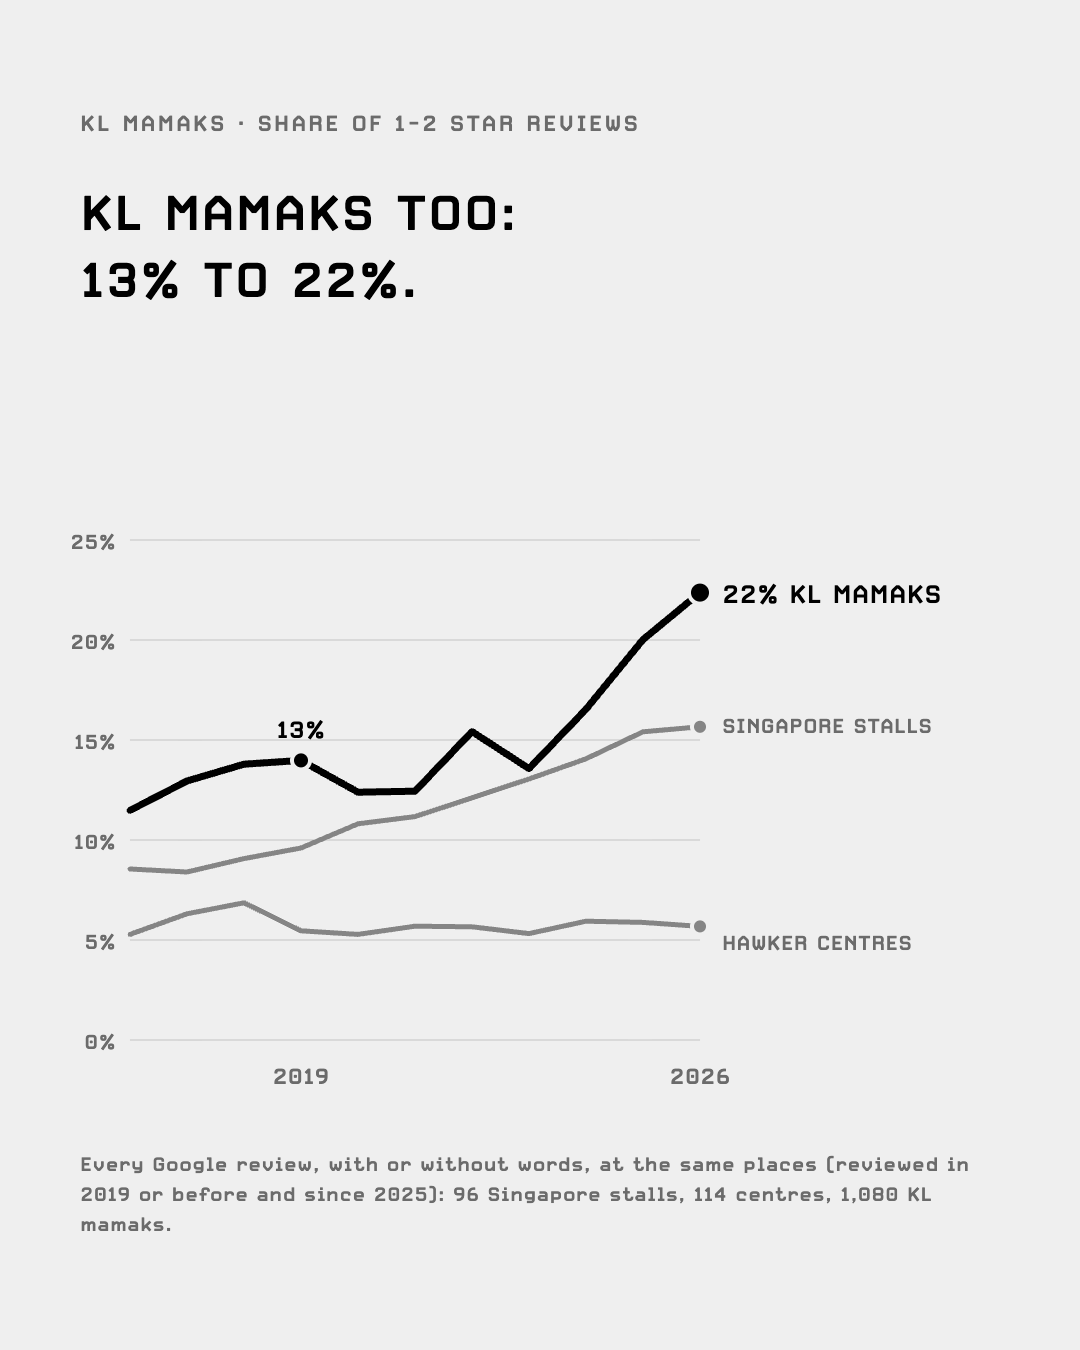
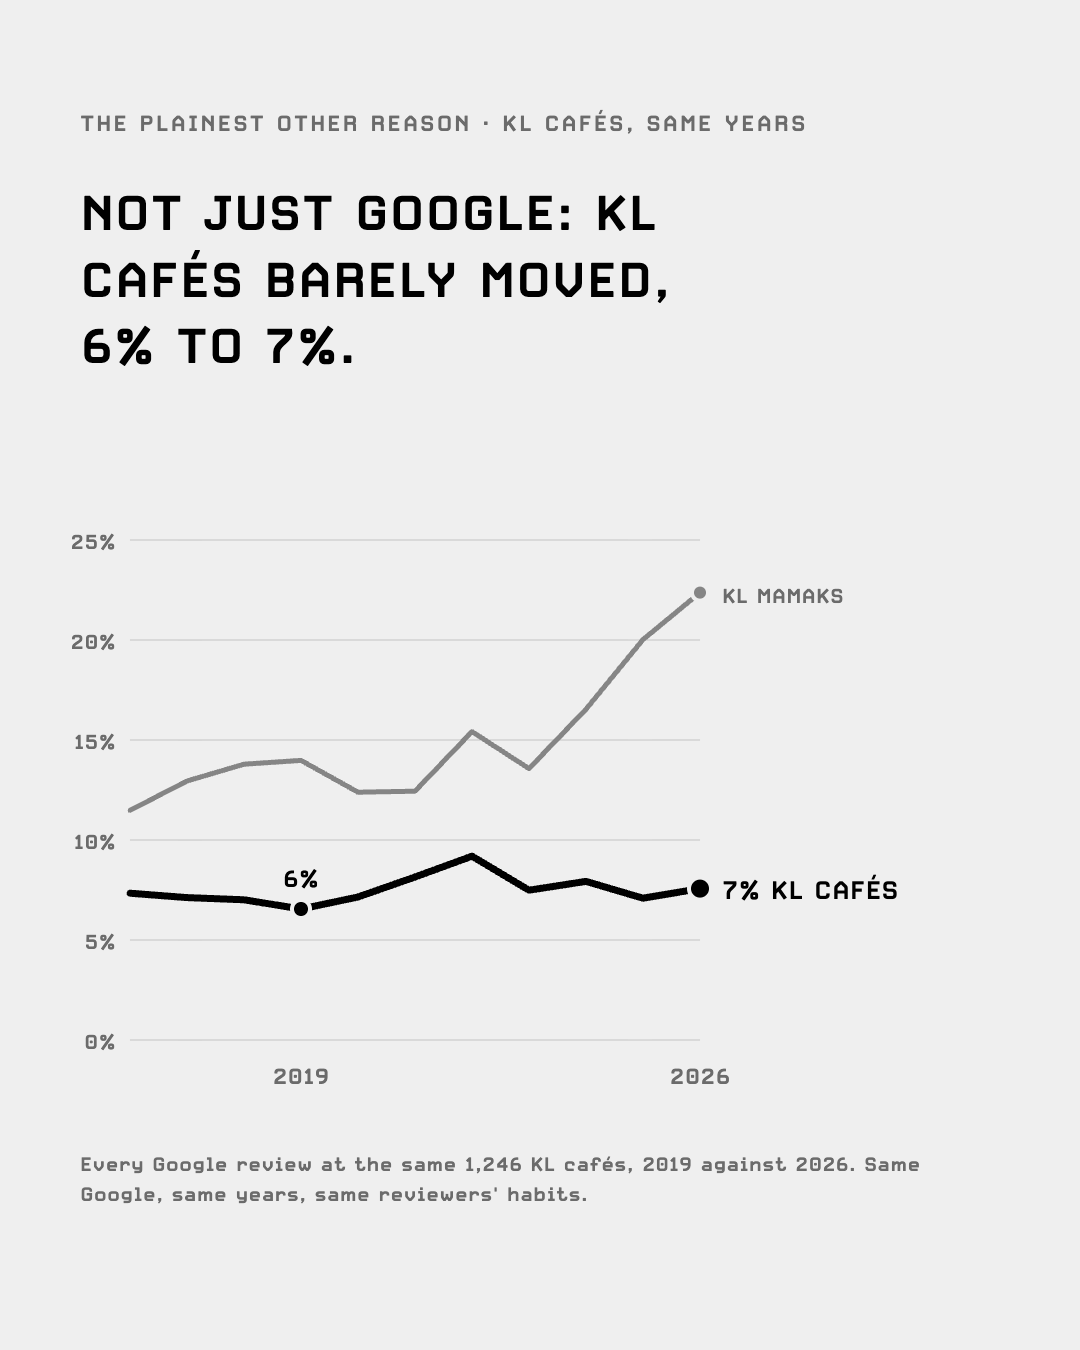
1. At a hawker centre, no. At one stall or mamak, yes.
Every Google review at the same places, 2019 against 2026 (places reviewed in 2019 or before and still in 2025 or later). The share of 1-2 star reviews: Singapore hawker stalls 9% to 15% (96 stalls); KL mamaks 13% to 22% (1,080); Singapore hawker centres reviewed as a whole stayed at 5% (114); KL cafés, as a check, 6% to 7% (1,246).
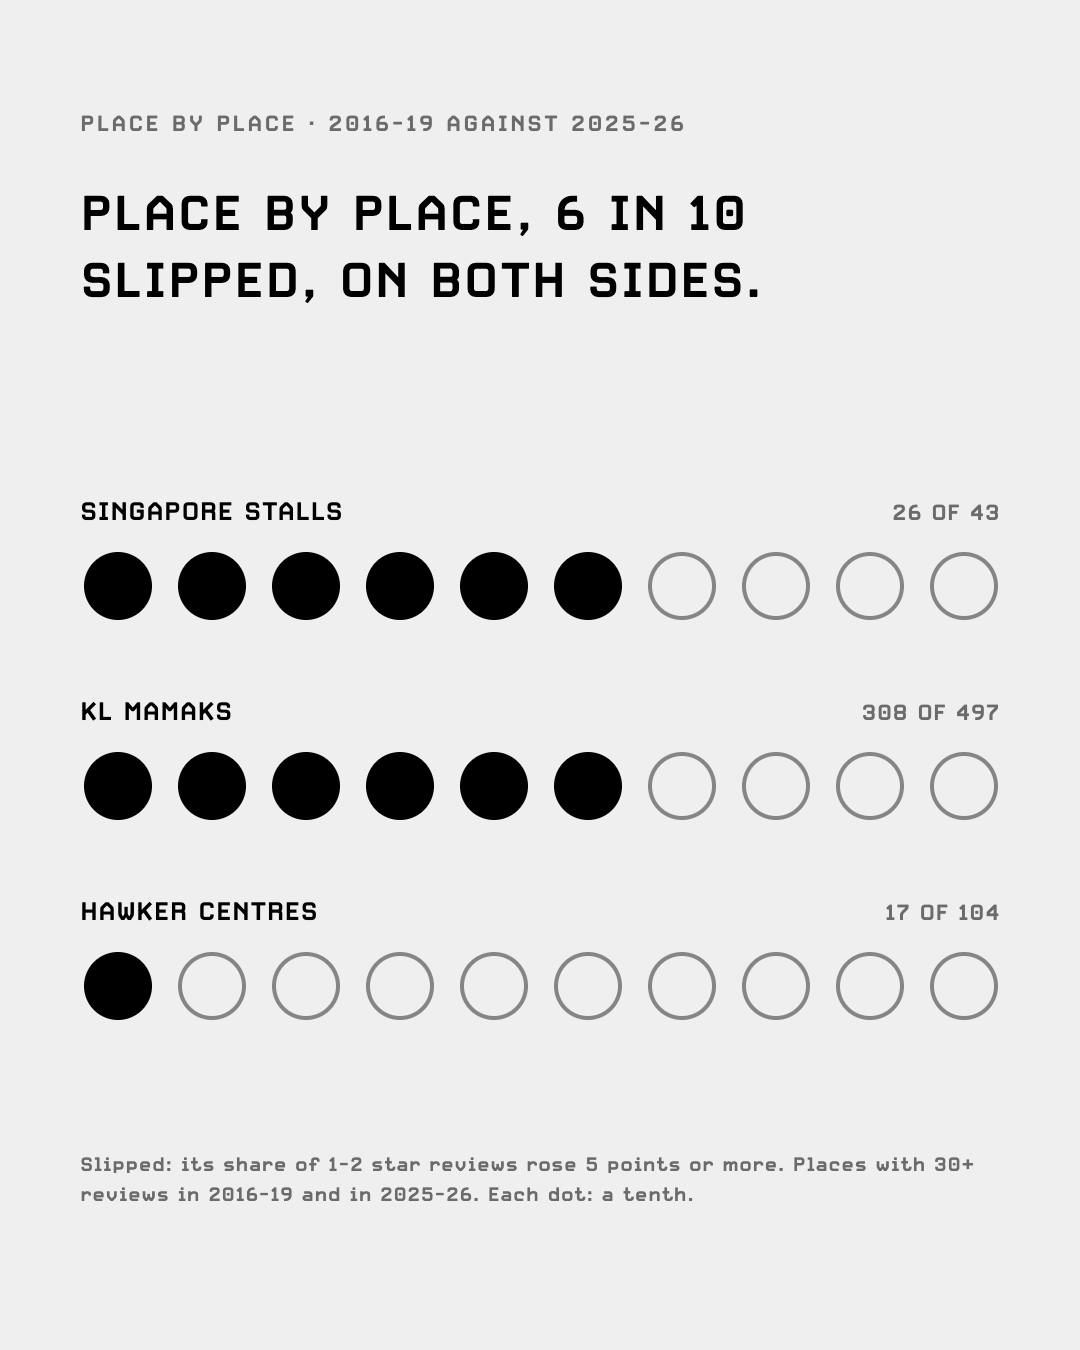
2. Place by place, 6 in 10 slipped on both sides.
Place by place (30+ reviews in 2016-19 and in 2025-26), the share of 1-2 star reviews rose 5 points or more at 26 of 43 Singapore stalls and 308 of 497 KL mamaks (6 in 10 on both sides), against 17 of 104 hawker centres. It held or fell at 6 stalls, 111 mamaks and 63 centres.
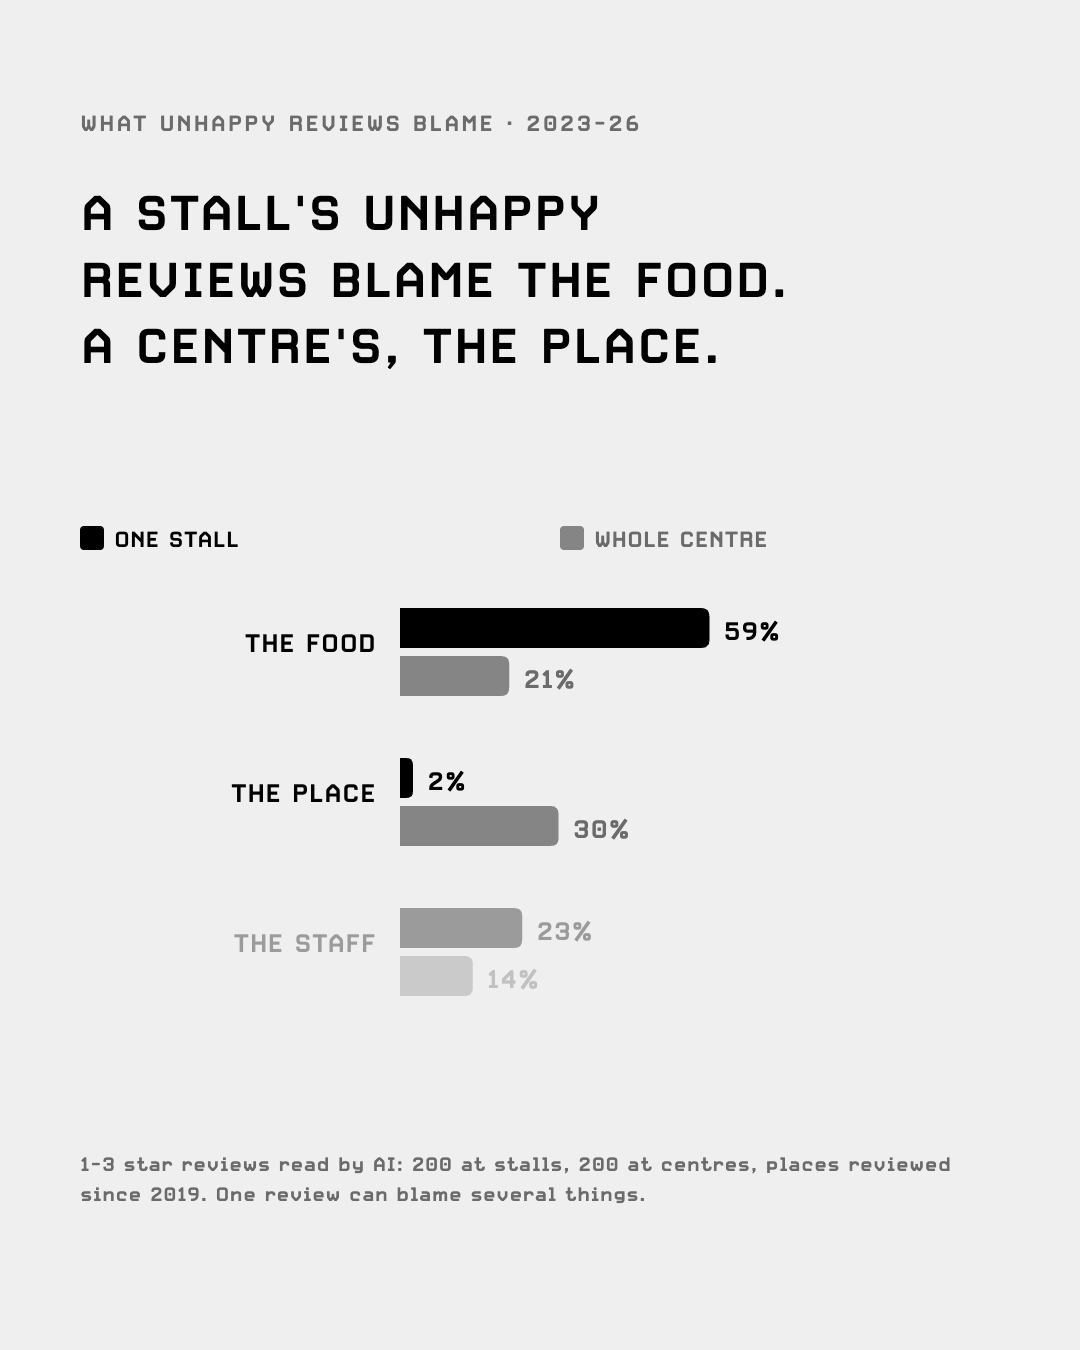
3. A stall’s unhappy reviews blame the food. A centre’s blame the place.
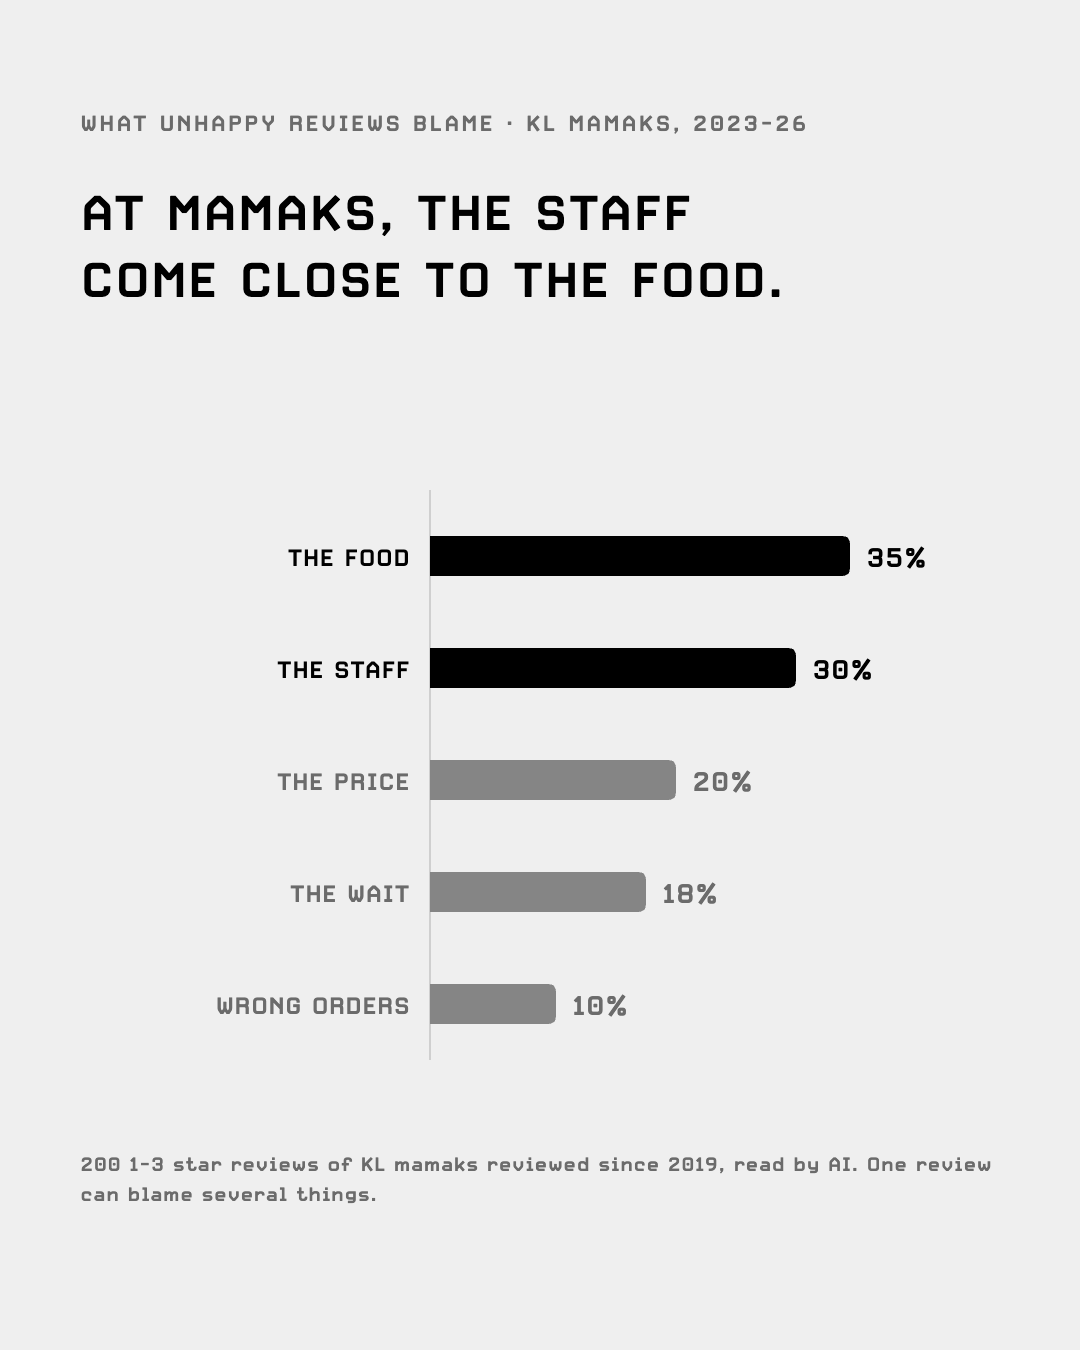
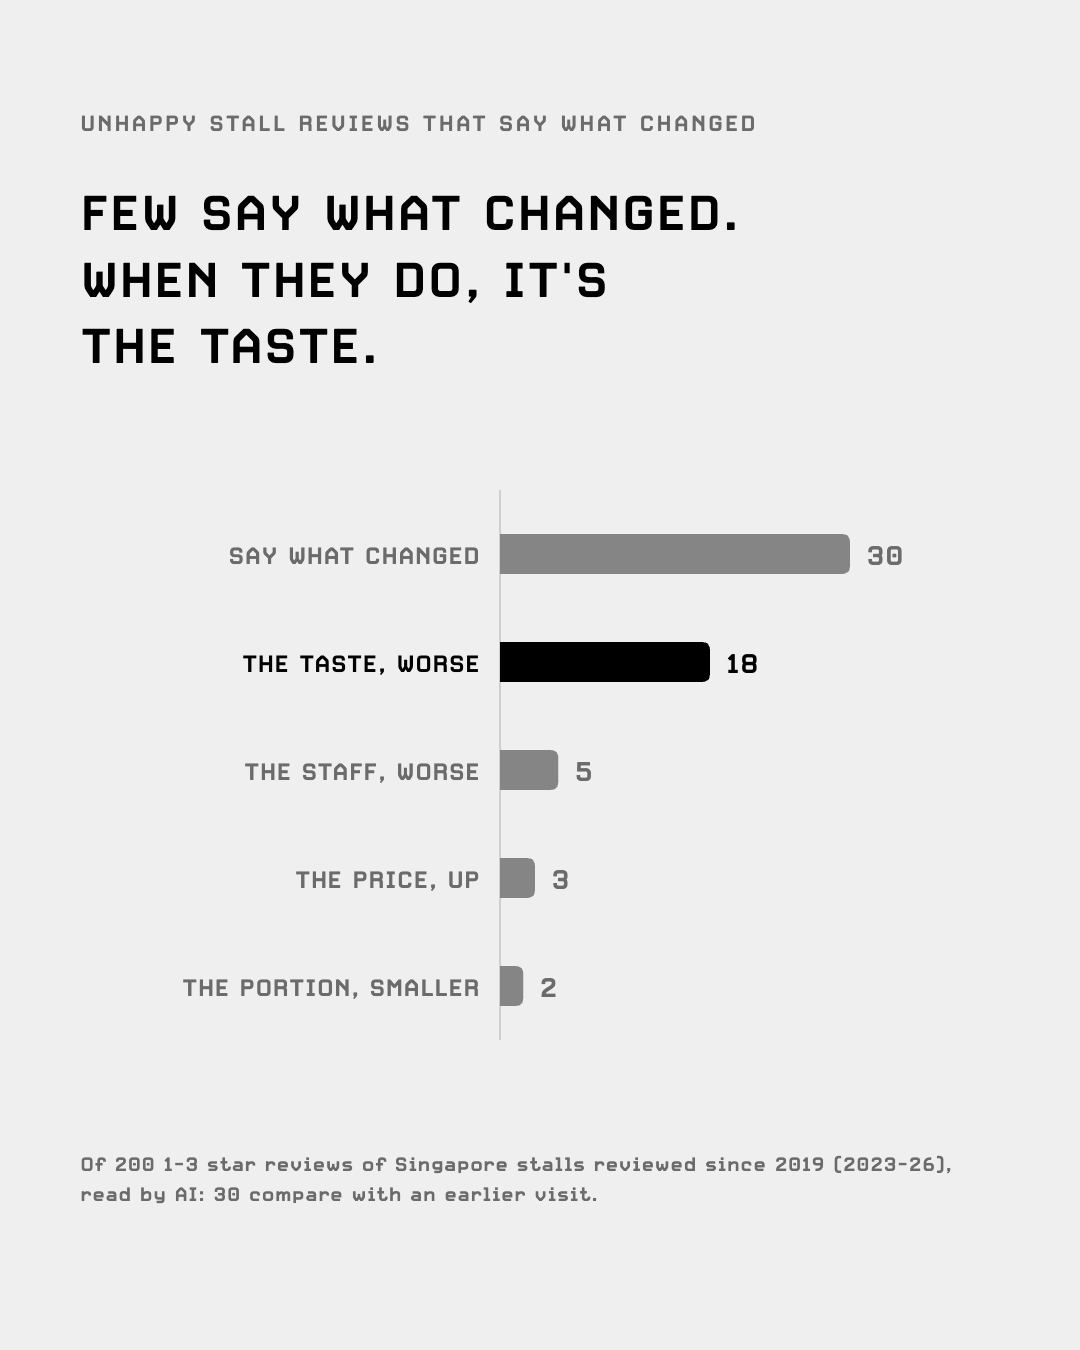
What unhappy (1-3 star, 2023-26) reviews blame, read by AI: at stalls the food (59%), then the staff (23%) and the wait (19%); at hawker centres the place, meaning the crowd, seats and heat (30%), then the food (21%); at KL mamaks the food (35%) and the staff (30%). Few say what changed: 30 of 200 at stalls, 18 of them the taste.
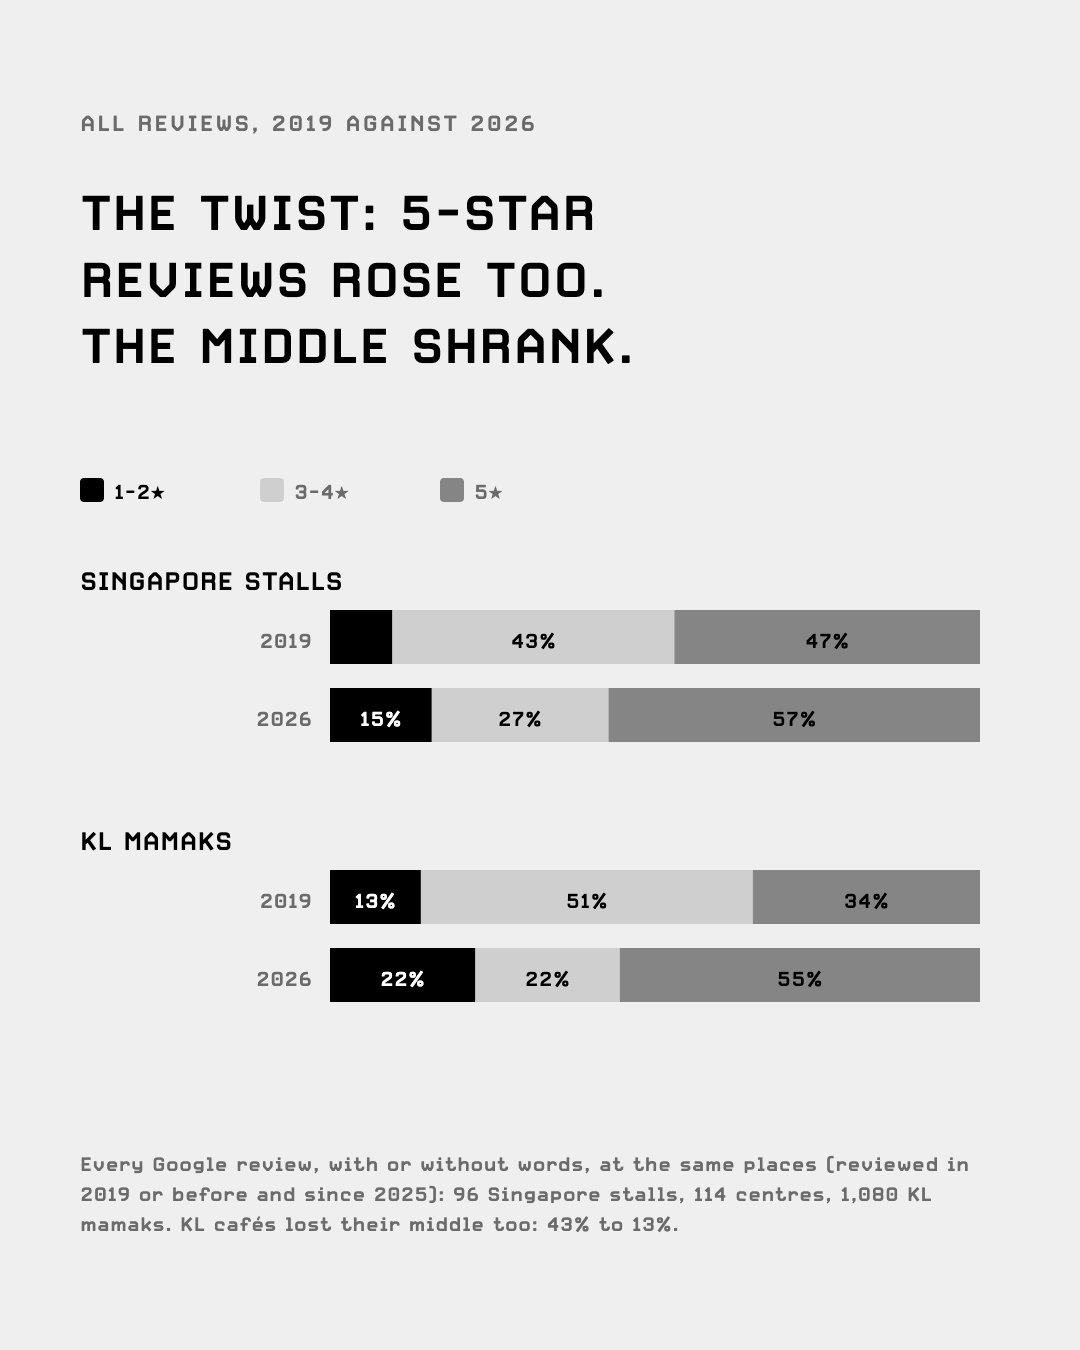
4. The twist: 5-star reviews rose too.
Five-star reviews rose too, and the 3-4 star middle shrank everywhere: stalls 43% to 27%, mamaks 51% to 22%, KL cafés 43% to 13%.
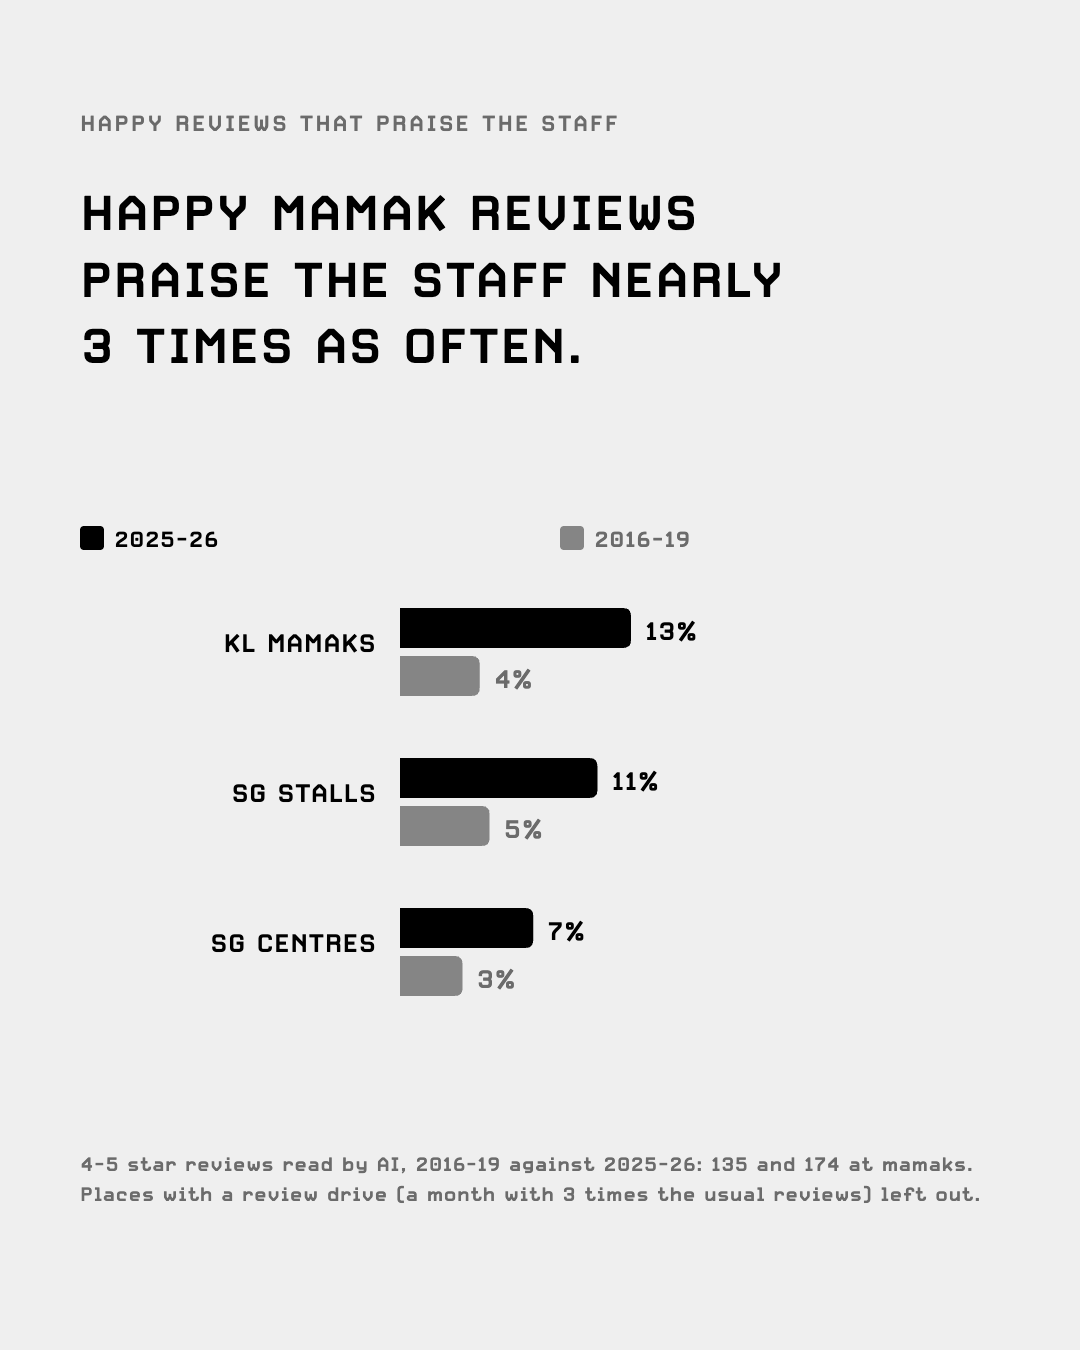
5. Happy reviews praise the people more.
Happy (4-5 star) reviews praise the staff more than before 2020: KL mamaks 4% to 13%, Singapore stalls 5% to 11%, hawker centres 3% to 7% (places with a review drive, a month with 3 times the usual reviews, left out). The rise holds in short reviews too. At mamaks, 5% of happy reviews now name a worker; none did in 2016-19.
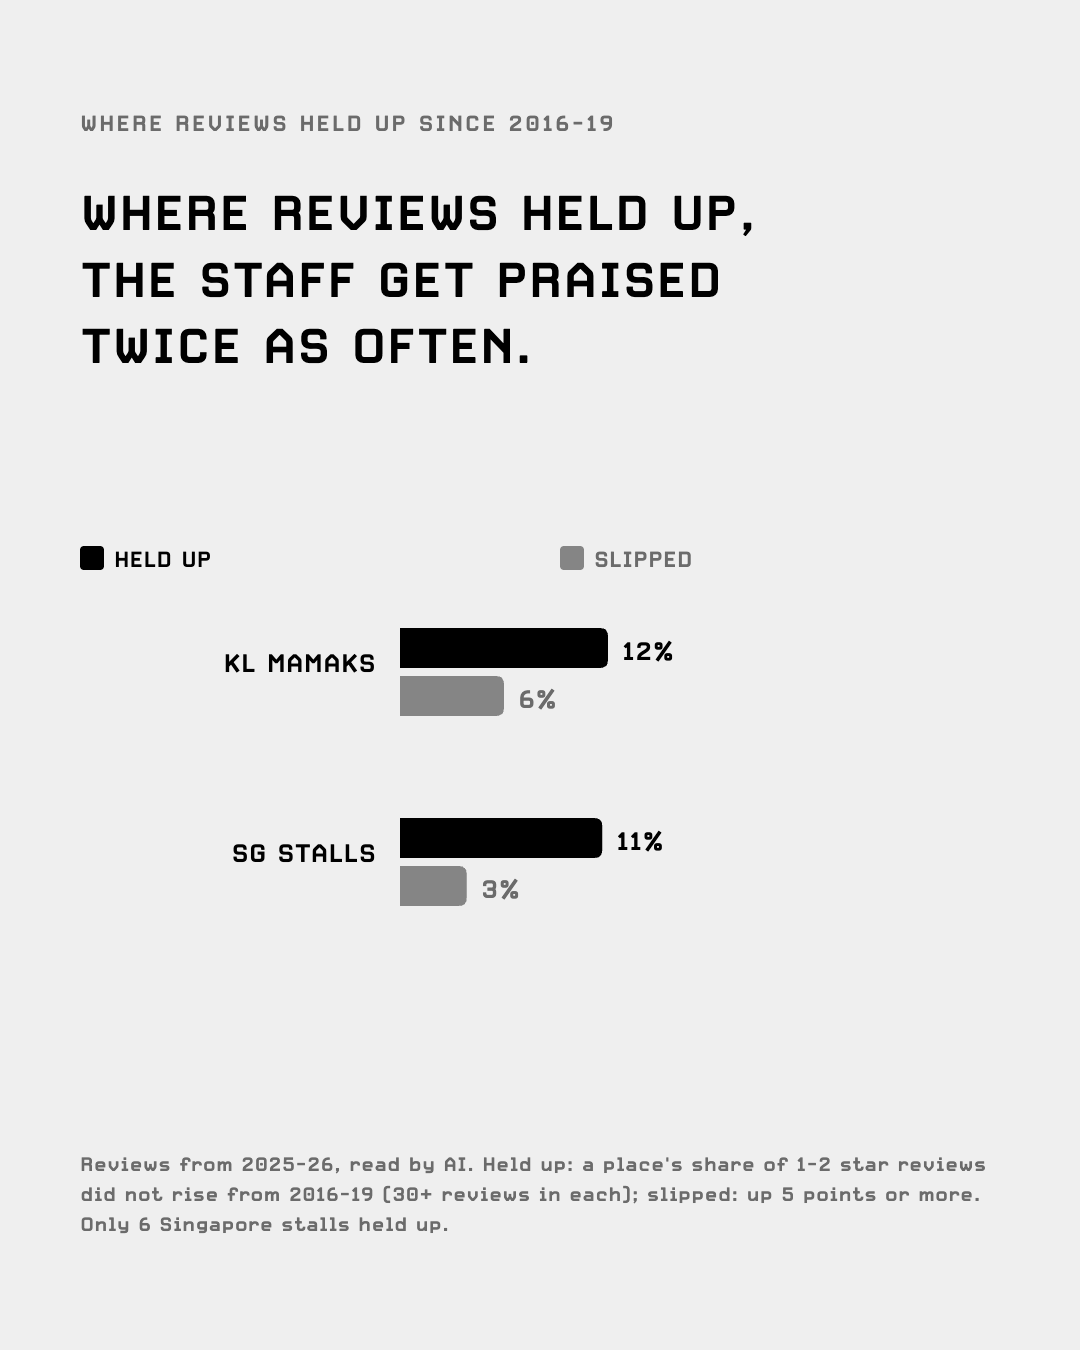
Where reviews held up, the staff get praised about twice as often: KL mamaks 12% against 6% where they slipped; Singapore stalls 11% against 3% (only 6 stalls held up).
Where the standard held.
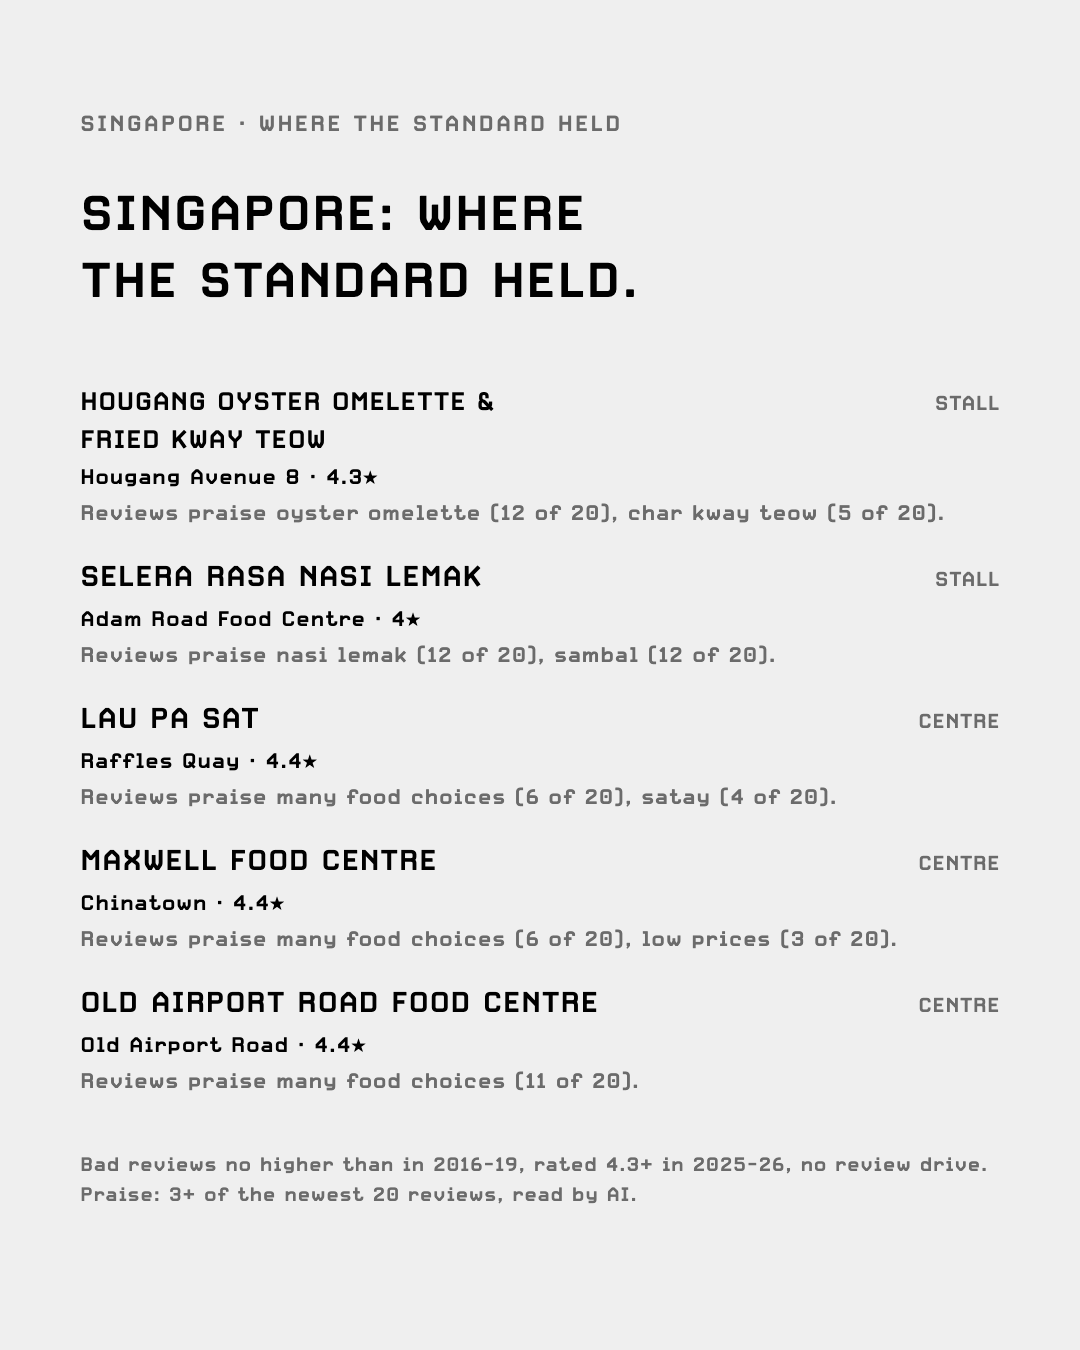
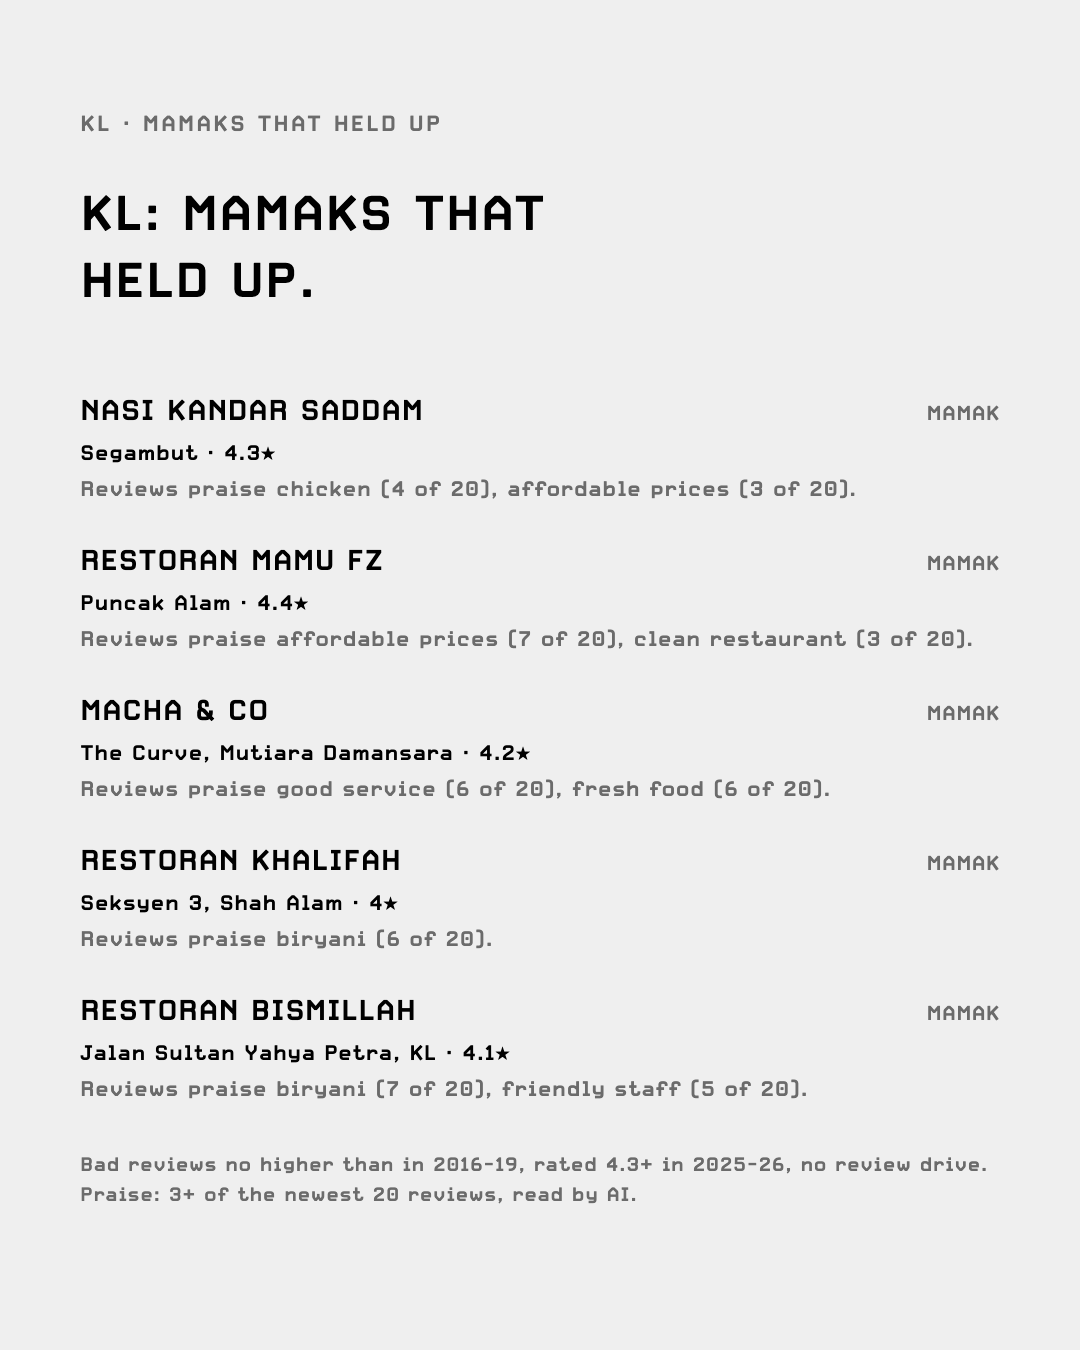
Places whose share of 1-2 star reviews in 2025-26 is no higher than in 2016-19 (30 or more reviews in each), rated 4.3 or more by 2025-26 reviewers, with no review drive and a review in the last 30 days. What their newest 20 reviews praise, read by AI: things named in 3 or more.
Singapore
| Place | Where | Google rating (reviews) | 1-2 star share, 2016-19 to 2025-26 | Its newest 20 reviews praise |
|---|---|---|---|---|
| Hougang Oyster Omelette & Fried Kway Teow | Hougang Avenue 8 | 4.3 (1,019) | 6% to 5% | oyster omelette (12 of 20), char kway teow (5 of 20) |
| Selera Rasa Nasi Lemak | Adam Road Food Centre | 4 (572) | 12% to 8% | nasi lemak (12 of 20), sambal (12 of 20) |
| Lau Pa Sat | Raffles Quay | 4.4 (39,281) | 5% to 2% | many food choices (6 of 20), satay (4 of 20) |
| Maxwell Food Centre | Chinatown | 4.4 (24,153) | 3% to 2% | many food choices (6 of 20), low prices (3 of 20) |
| Old Airport Road Food Centre | Old Airport Road | 4.4 (12,762) | 3% to 3% | many food choices (11 of 20) |
KL
| Place | Where | Google rating (reviews) | 1-2 star share, 2016-19 to 2025-26 | Its newest 20 reviews praise |
|---|---|---|---|---|
| Nasi Kandar Saddam | Segambut | 4.3 (2,512) | 8% to 6% | chicken (4 of 20), affordable prices (3 of 20) |
| Restoran Mamu FZ | Puncak Alam | 4.4 (2,289) | 7% to 7% | affordable prices (7 of 20), clean restaurant (3 of 20) |
| Macha & Co | The Curve, Mutiara Damansara | 4.2 (1,351) | 15% to 5% | good service (6 of 20), fresh food (6 of 20) |
| Restoran Khalifah | Seksyen 3, Shah Alam | 4 (1,529) | 9% to 7% | biryani (6 of 20) |
| Restoran Bismillah | Jalan Sultan Yahya Petra, KL | 4.1 (1,200) | 8% to 4% | biryani (7 of 20), friendly staff (5 of 20) |
Both sides win.
Singapore’s stalls get fewer bad reviews than KL mamaks, and its hawker centres held steady. KL mamaks gained the most praise for their people. Both sides slipped the same way: one kitchen at a time.
If I were opening one.
I’d hire for the counter first. Unhappy mamak reviews blame the staff 30% of the time, close to the food’s 35%, and where reviews held up, the staff get praised twice as often.
Run a stall or mamak? Could you taste the plate before it leaves? Could your warmest person stand at the counter? A test, not a promise: these go with steadier reviews; they don’t prove what causes them.
How I did it.
Places: Singapore hawker centres and stalls from a Google Maps search, sorted by an AI read of their reviews; Klang Valley mamaks from an earlier pull of every mamak Google Maps lists there (DataForSEO for places, Litescrape for every review). Code counted the stars of every review at the same places by year. An AI read (Codex) of fixed random samples recorded what each review praises, faults and says changed, each with a quote that code found word for word (4,300 of 4,302). A second AI read checked 36 tags (34 right, the rest partly right).
Want all the charts at once? Download them in one PDF.
What it can’t tell you.
We don’t know who wrote each review. How people review changed too: Google added questions to its review form, reviews got longer, and the 3-4 star middle shrank everywhere, cafés included. Months with review drives (3 times a place’s usual reviews) add 5-star reviews; leaving them out, bad reviews rose more, not less. A hawker centre’s review is about the whole centre. Everything here shows what goes together, not what causes what.
The whole series.
Seven fights, checked with data: who wins what, nasi lemak, JB prices, pay or life, bland food, hawkers against mamaks, and one dish each.
Say hello.
Writing about hawker food, or want the numbers? Email me at [email protected].
Run a business in Malaysia? Ask for a free check of your place.
What I do with it.
Reading what people already say is one way I find what to build.


